We often assume investors have become more sophisticated - armed with multi-factor models, real-time data and AI-powered tools. But when markets face hard-to-digest shocks (like a potential surge in tariffs), the flight to low beta is alive and well.
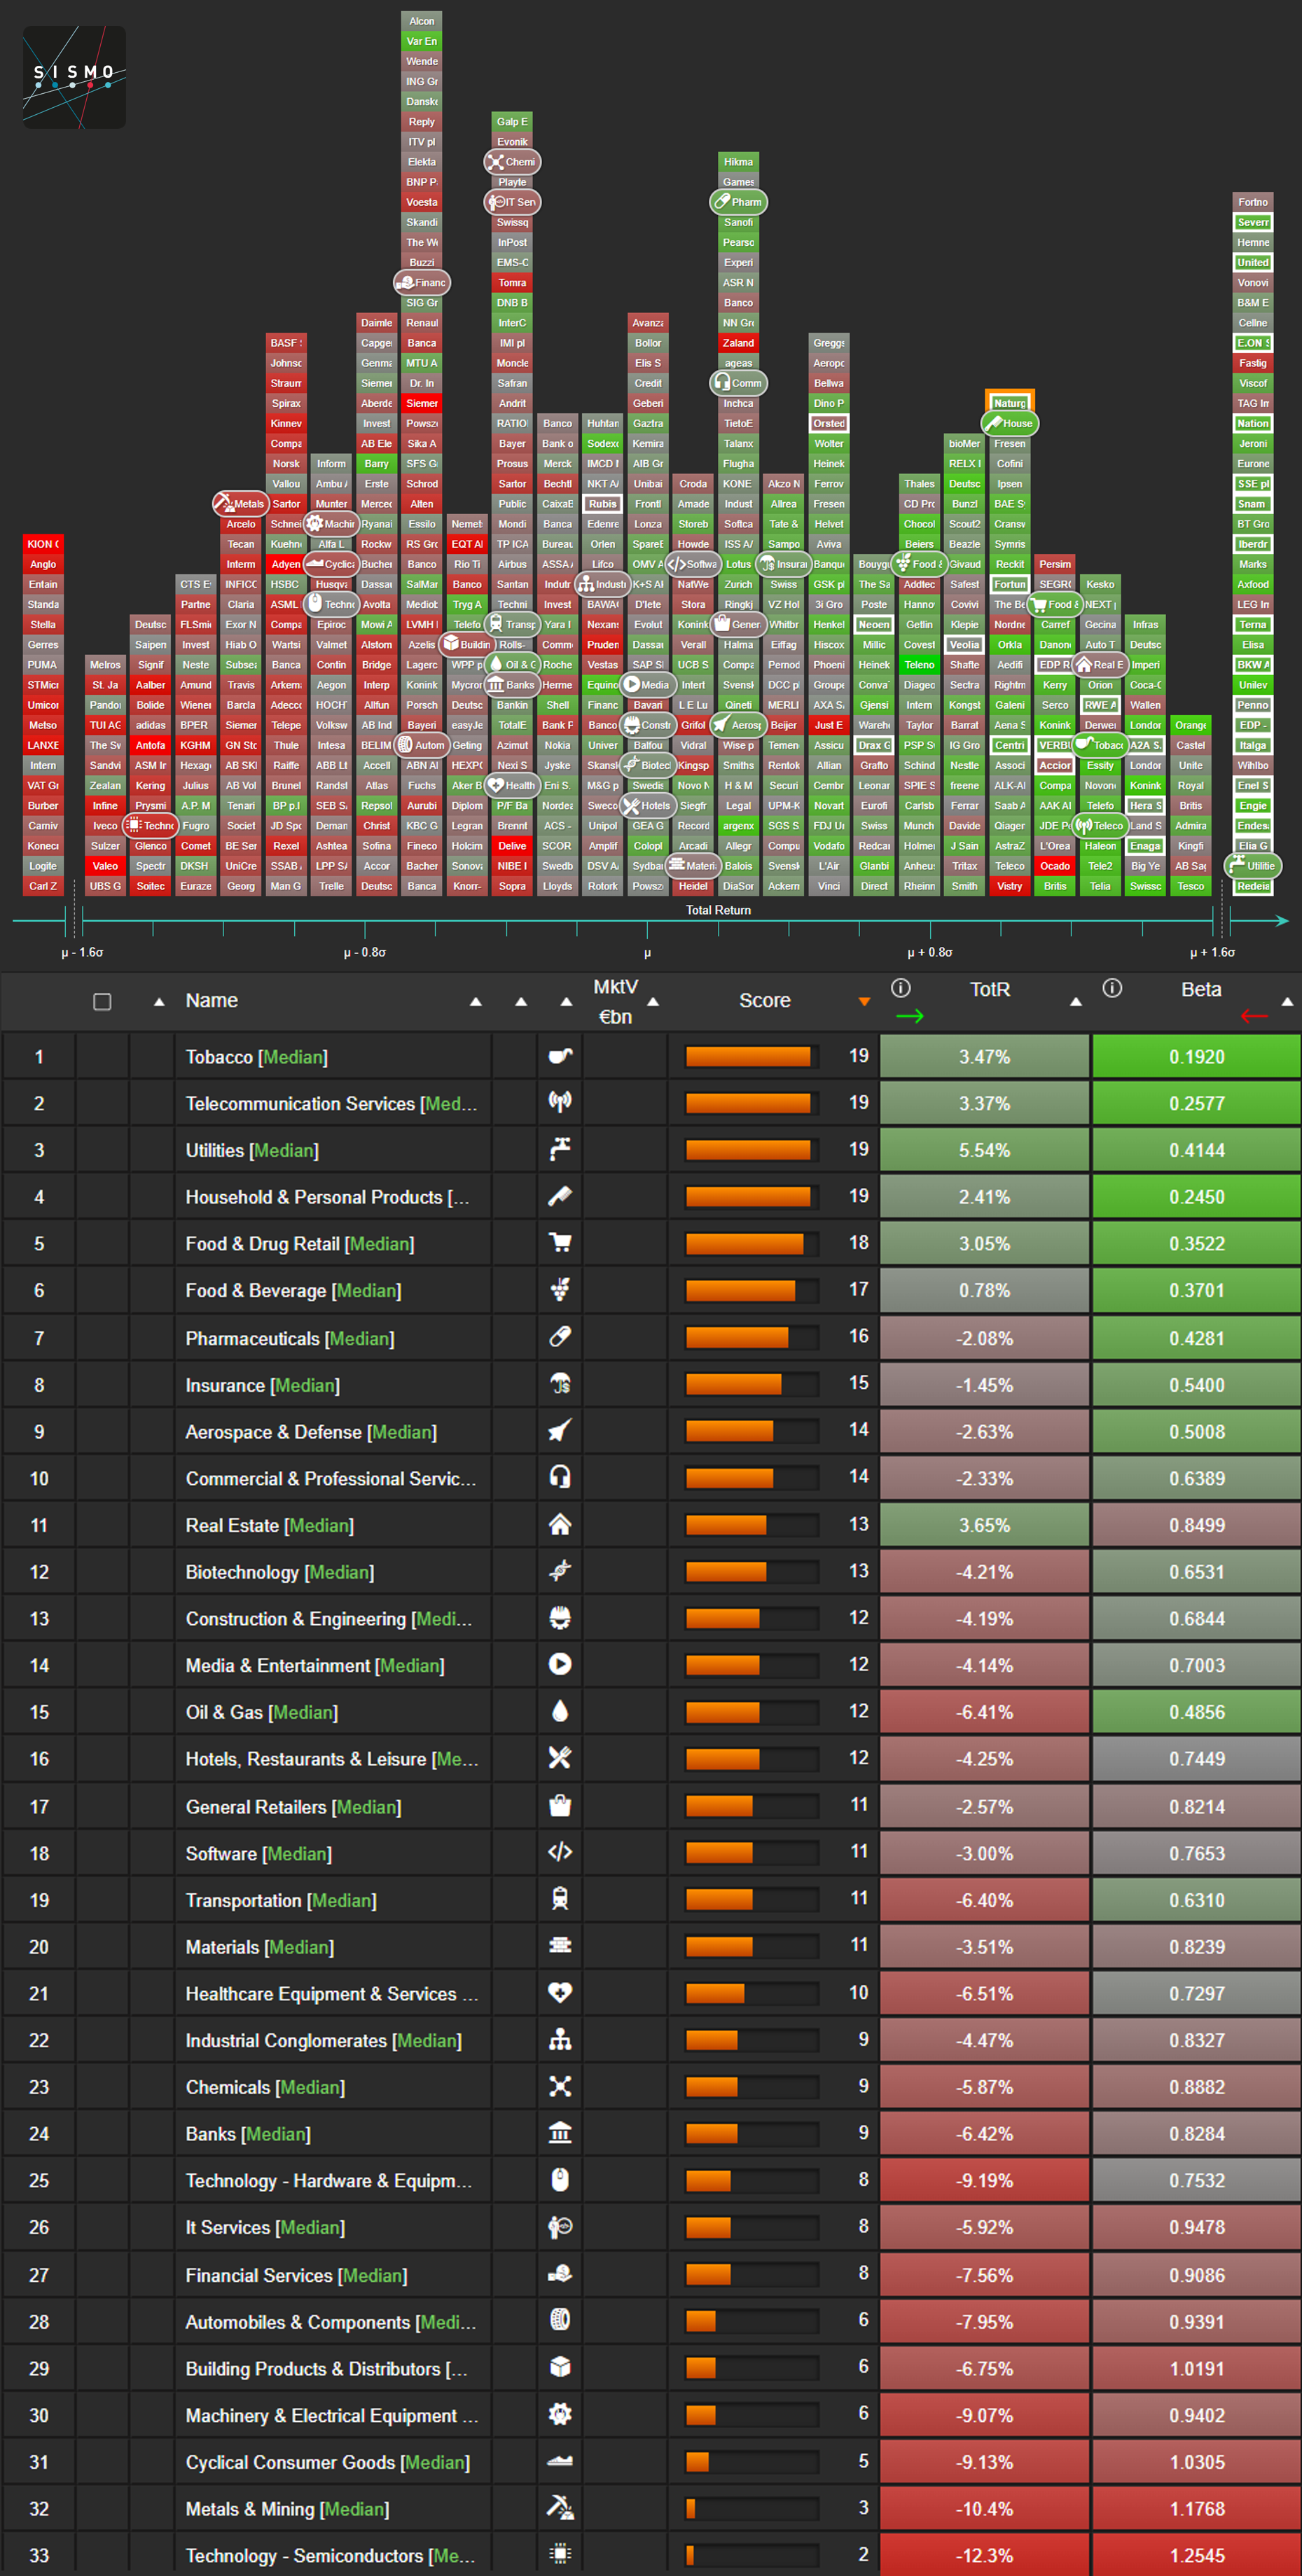
In the Sismo visual below, we show the distribution of 1-week total returns for the Stoxx Europe 600 stocks. The tails have been trimmed at 1.6 standard deviations from the average to improve readability. Rounded tiles represent sector medians, while the color gradient maps each stock's 2-year daily beta versus MSCI Europe - from green (low beta) to red (high beta). Utilities are framed in white.
The pattern is striking: a strong inverse correlation between color (beta) and position (return). Utilities are clustered in the right-hand tail, dominating the outperformance - yet again illustrating how low-beta stocks tend to shine when uncertainty hits.
A second visual presents a table summarizing the median 1-week total return and median 2-year daily beta for 33 industries. We also show a score, which combines each industry’s median decile position across both axes. All data as of market close on April 3, 2025.
This brings us back to the origins of beta - first formalized in the 1960s with the Capital Asset Pricing Model (CAPM). Designed as a tool to explain returns in a rational market, beta may have become something else: a powerful behavioral signal.
Investors still run for shelter when clouds gather - and beta continues to guide their flight path. Is this risk-aware positioning, or just modern crowd behavior?