Tomorrow the Federal Reserve meets to decide on interest rates. Investors know the decision will ripple across markets - but how do we measure it?
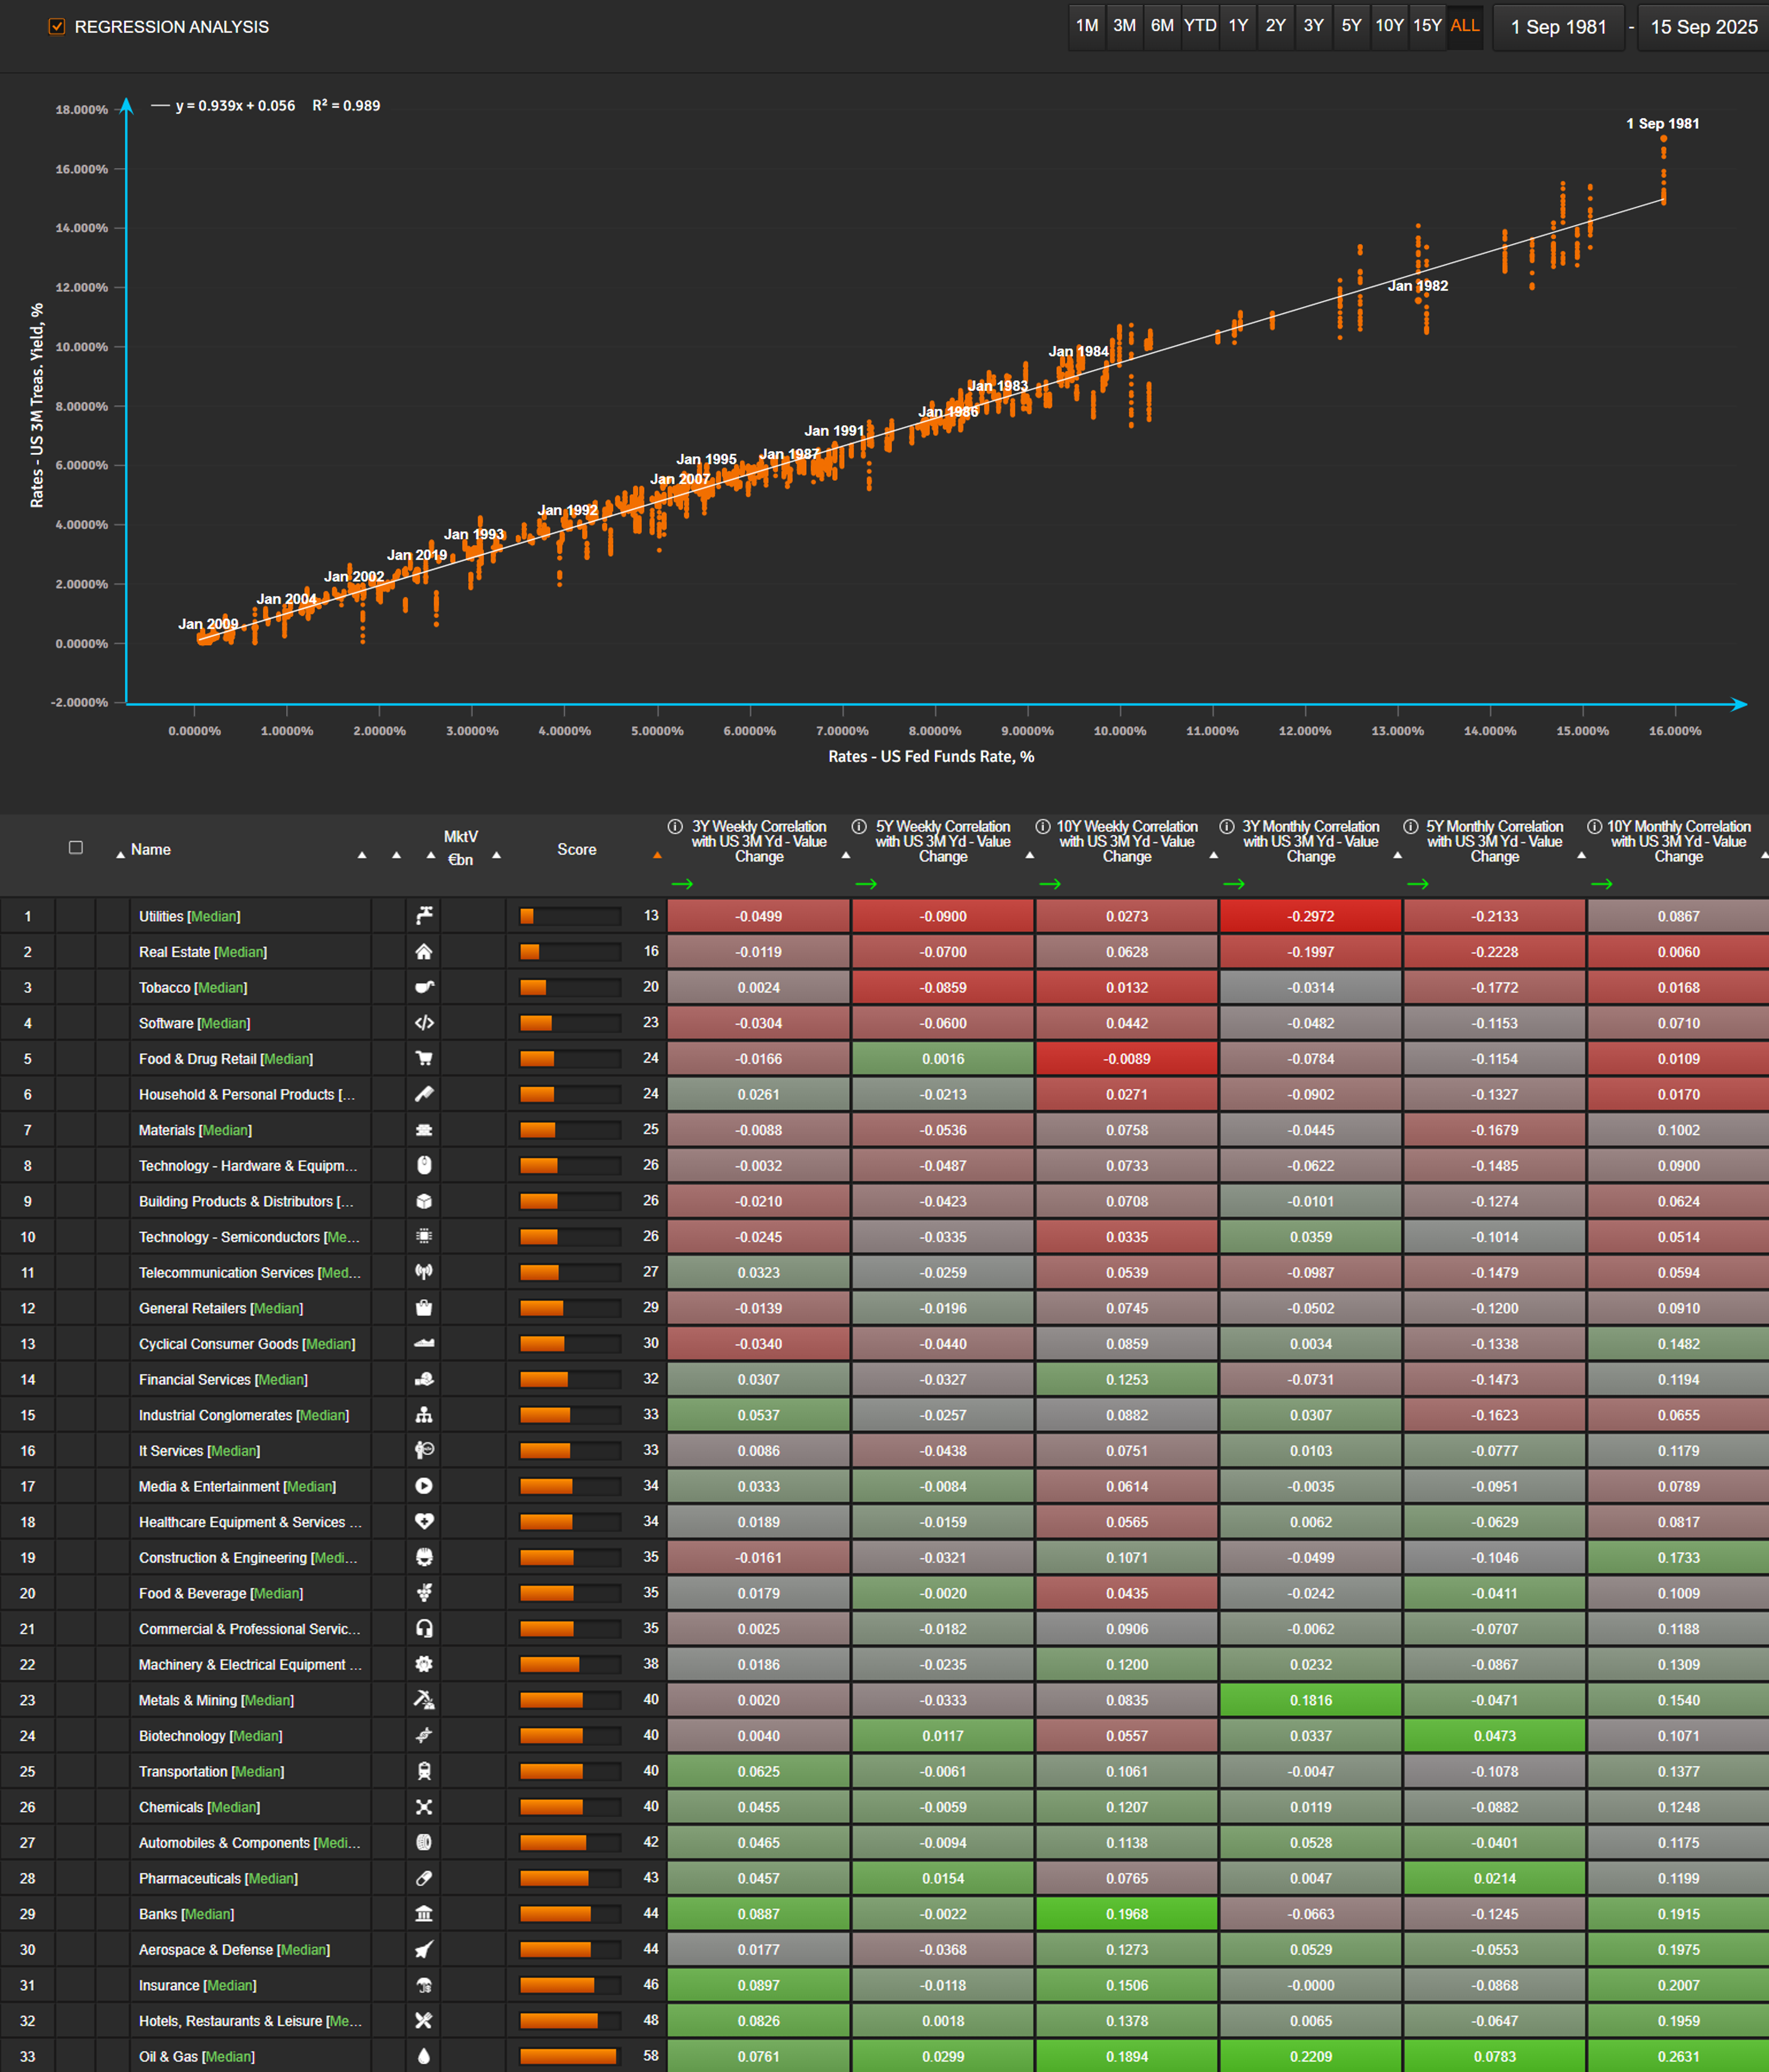
Looking back more than 40 years, the Fed Funds rate has moved almost in lockstep with the 3-month Treasury yield (R² > 0.99). That makes the 3M yield the best proxy for Fed policy.
From there, the question becomes:
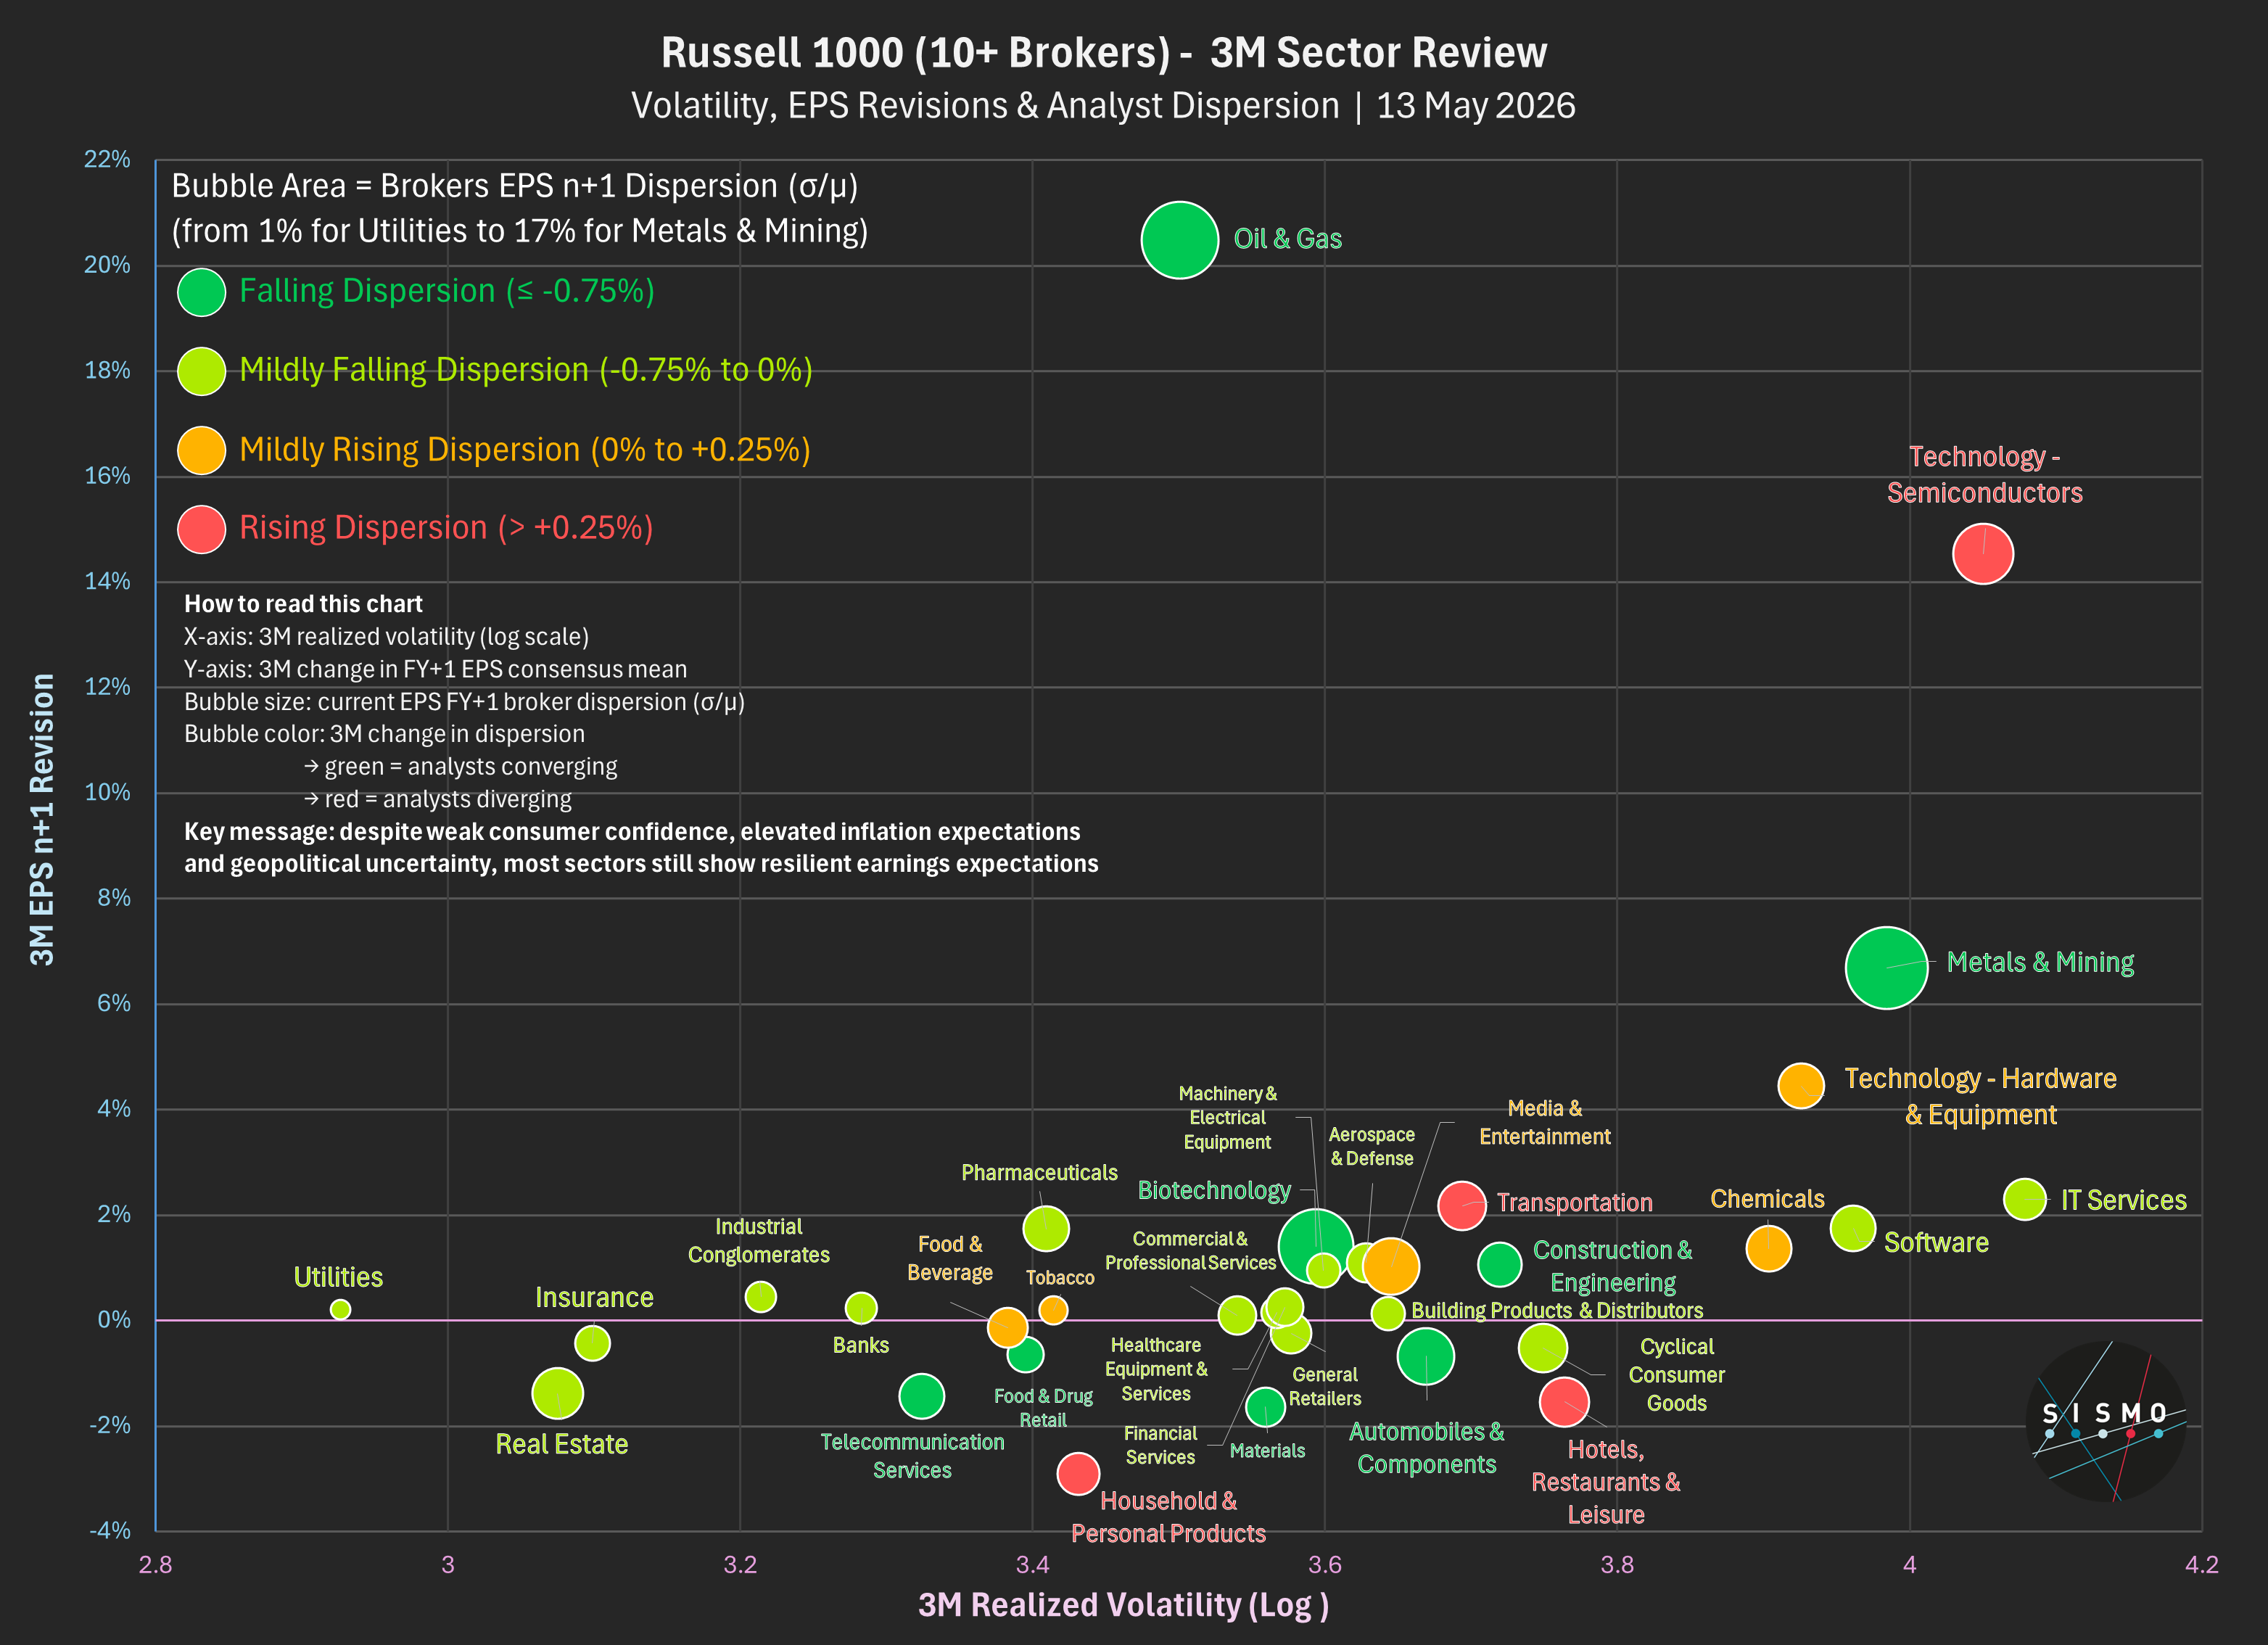
How do individual US stocks - and entire sectors - react when the 3M yield moves?
At Sismo, we measure weekly and monthly correlations of Russell 1000 stocks to changes in the 3M yield, across 3-, 5-, and 10-year windows. We then aggregate results at the sector level.
Here’s what the data shows today:
But the backdrop matters. With inflation risks still alive, the Fed faces a dilemma: ease too much and risk inflation, or stay tight and risk recession. If investors focus on that trade-off, they may be more reluctant to play the usual correlation trades.
The question for tomorrow:
Will markets follow the old playbook, or is a new regime taking shape?
Note: The sector view is insightful, but it can be taken further. On Sismo, the same analysis can be run at the individual stock level, then transformed into a custom factor to measure a portfolio’s holdings sensitivity to rate changes - all in just a few clicks.