.png)
48 factor baskets, two formation dates and a sector rotation that changes the reading of YTD performance.
Over the three months to 11 September, all five momentum baskets in the Sismo Factor Library delivered negative long-short total returns in both Europe and the US. All four Value baskets were positive in both markets.
Value also takes the top two places in Europe's three-month factor ranking and the top three in the US. The result appears across several definitions of momentum and valuation, and across two equity universes. Yet the YTD picture still shows strong performance for several momentum baskets, particularly in the US.
Combining these two horizons with sector performance reveals where market leadership has changed - and which portfolio exposures deserve a closer look.
The US Trend Strength basket formed on 31 December 2025 returned +23.6% through 11 September. The basket selected using the same factor on 11 June returned −12.9% over the following three months. In Europe, the corresponding results were +8.12% and −5.19%.
These are different starting selections. The June result is not the last three months of the December basket's performance. It measures what happened to a fresh selection made using the information available in June.
The change in holdings is substantial. Only 99 of the 235 stocks in June’s upper quartile also belonged to December’s upper quartile. For the lower quartile, the overlap was 91 out of 235. More than half the constituents of each June basket were therefore different.
AppLovin, Palantir and Snowflake illustrate the shift: all three belonged to December’s upper quartile and June’s lower quartile. Keeping the same factor definition can lead to substantially different holdings when the selection is refreshed.
Relative Value is positive across both windows: +18.1% YTD and +12.4% over three months in Europe, against +5.04% and +10.4% in the US.
Historical Earnings Value tells a different story. Its December selections returned −12.8% in Europe and −17.5% in the US. Its June selections returned +3.98% and +16.6%, respectively. This factor compares each company's earnings valuation with its own five-year history. A company can look expensive beside its peers and still look inexpensive relative to its own past valuation. Relative Value and Historical Earnings Value consequently answer different stock-selection questions.
Spotify and General Motors make this distinction tangible. On 11 September 2026, both displayed an average rank of 483 across the two Value factors, measured against the Russell 1000 ETF proxy universe.
Yet Spotify ranked 880 on Relative Value and 85 on Historical Earnings Value, while General Motors ranked 50 and 916, respectively. Spotify’s stronger exposure was to valuation relative to its own five-year history; General Motors’ was to relative valuation.
Fidelity National Information Services had high exposure to both factors, with an average rank of 68, while Tesla had low exposure to both, averaging 974. Note: Rank 1 indicates the highest factor exposure. Average ranks are rounded to whole numbers.
The same average rank can conceal opposite valuation profiles. Looking at the factors separately helps a portfolio manager identify which definition of Value each holding expresses.
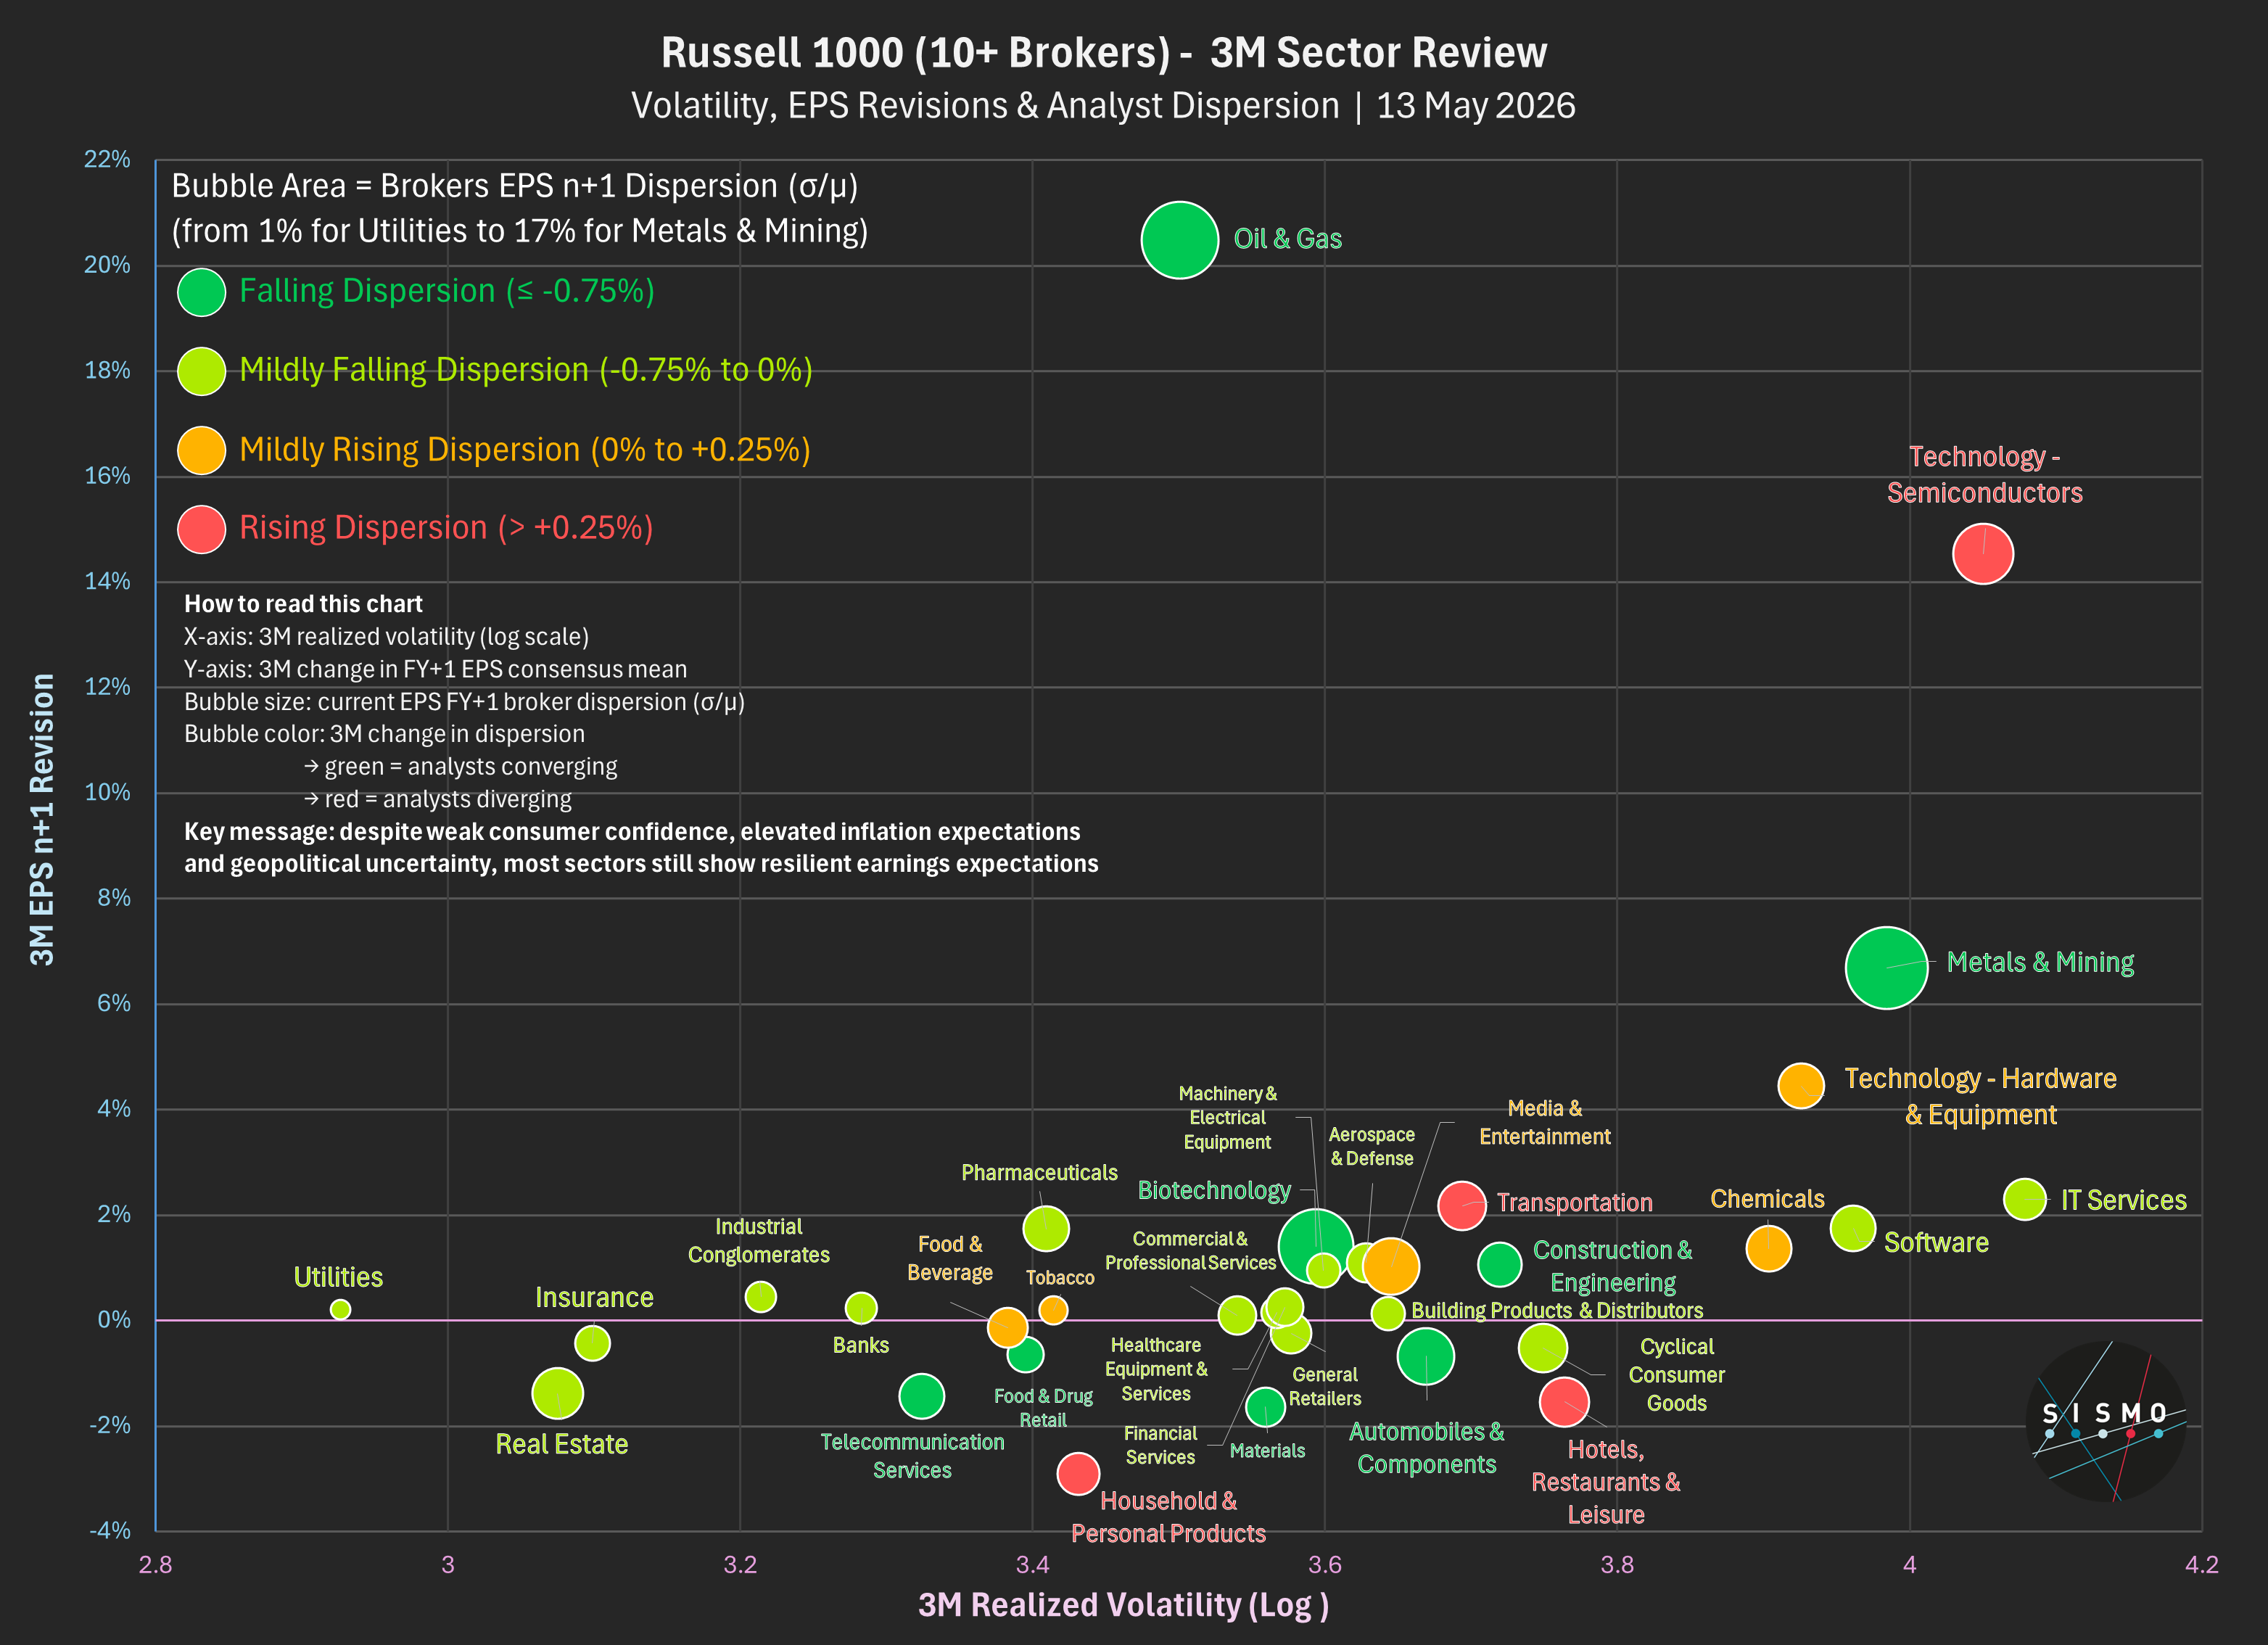
The sector snapshots show a pronounced reshuffling of leadership in both regions.
Semiconductors remain strong in YTD terms but rank last of 33 sectors over three months in each universe. Their median stock total returns are +51.3% YTD and −25.2% over three months in Europe, versus +37.0% and −24.0% in the US.
Software ranks first over three months in both universes, with median returns of +23.0% in Europe and +30.2% in the US, despite negative YTD medians.
This reversal in sector leadership is consistent with the weakness of the June momentum baskets.
.png)
The latest month adds a qualification: software’s one-month median is negative in both markets, and 25 of 33 sectors have negative one-month medians in each universe. The quarterly catch-up has not translated into positive software performance over the latest month. Oil & Gas, however, remains positive across all three horizons in both regions.
Over three months, the Brent Oil sensitivity basket returned −0.13% in Europe and +9.60% in the US. Oil & Gas sector medians were positive in both universes, at +6.8% and +8.3%, respectively.
The measures capture different things. The sector median describes returns within an industry group. The factor basket compares companies across the universe according to their estimated historical sensitivity to Brent, buying the upper quartile and selling the lower quartile. Its result depends on both legs.
Similarly, the US 10Y Yield sensitivity baskets remained positive over three months - +7.69% in Europe and +2.62% in the US - but the magnitude differs substantially between regions.
These comparisons give a PM concrete reasons to inspect macro exposures within a portfolio, including those that an industry classification may not make obvious. They do not establish that one macro variable caused the observed returns.
Sismo’s 48-factor library complements its standard factors, including its Value measures, so you can examine portfolio exposures in greater detail. Three questions put this into practice:
Sismo combines these comparisons with portfolio simulation and optimisation to help you test adjustments against your intended positioning.
Explore the library and choose your factors to build a selection suited to your investment approach.
Which exposures would you keep, reduce or strengthen? We would be pleased to explore these questions with you, using your own portfolio.