The last three months in the S&P 500 weren’t random.
The divergence across styles tells a clear story.
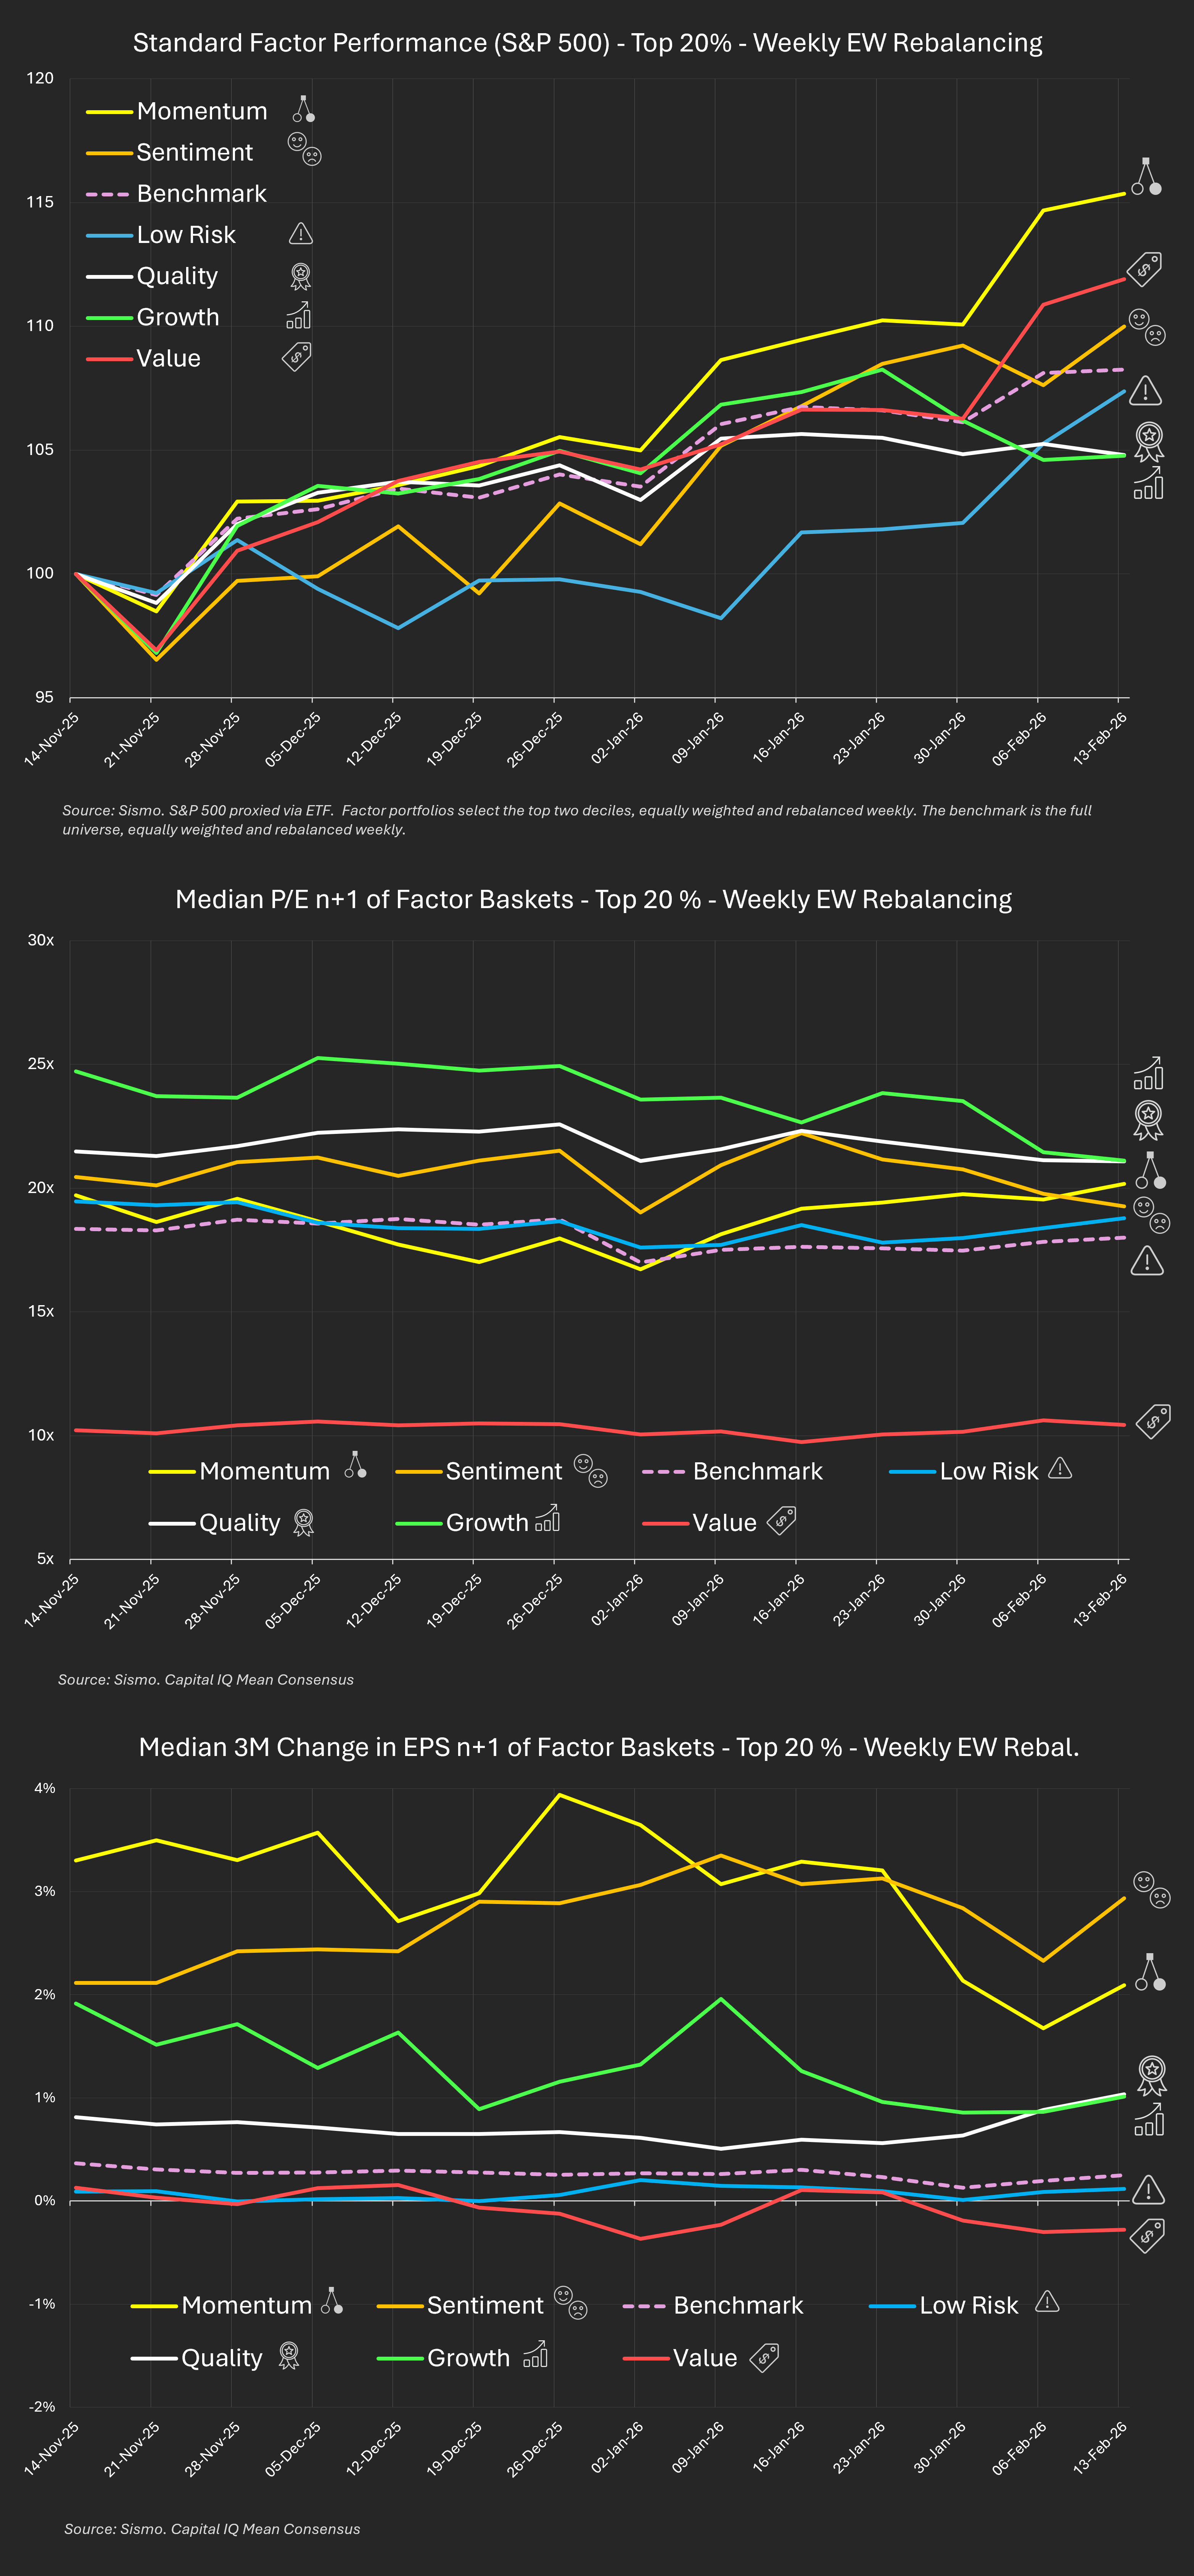
Using weekly rebalanced top-20% factor baskets, measured against the full equal-weight universe, here’s what happened:
Mid-Nov → Mid-Feb
- Momentum: +15%
- Value: +12%
- Equal-weight universe: +8%
- Growth & Quality: ~+5%
Dispersion widened materially - especially from early January, during earnings season.
Returns alone don't explain much.
So we decomposed the drivers.
For each basket, weekly, we tracked:
- Median FY+1 P/E
- Median 3M change in FY+1 EPS estimates
(valuation interpretation excludes the FY roll at year-end)
What drove the divergence?
Momentum: earnings-backed leadership
- Highest earnings revision profile (~3% vs ~0.3% for the universe).
- Modest multiple expansion.
- Leadership appears fundamentally supported.
Value: re-rating despite weak revisions
- Revisions flat to negative.
- Multiples expanded.
- Performance looks re-rating driven.
Growth & Quality: a de-rating phase
- Revisions positive but not accelerating.
- Multiples compressed.
- Underperformance appears valuation-driven.
The broader point
The last three months weren’t a simple “risk-on” phase.
They reflect:
- Earnings-backed leadership
- Valuation catch-up in discounted names
- De-rating in expensive segments
Different drivers. Same market.