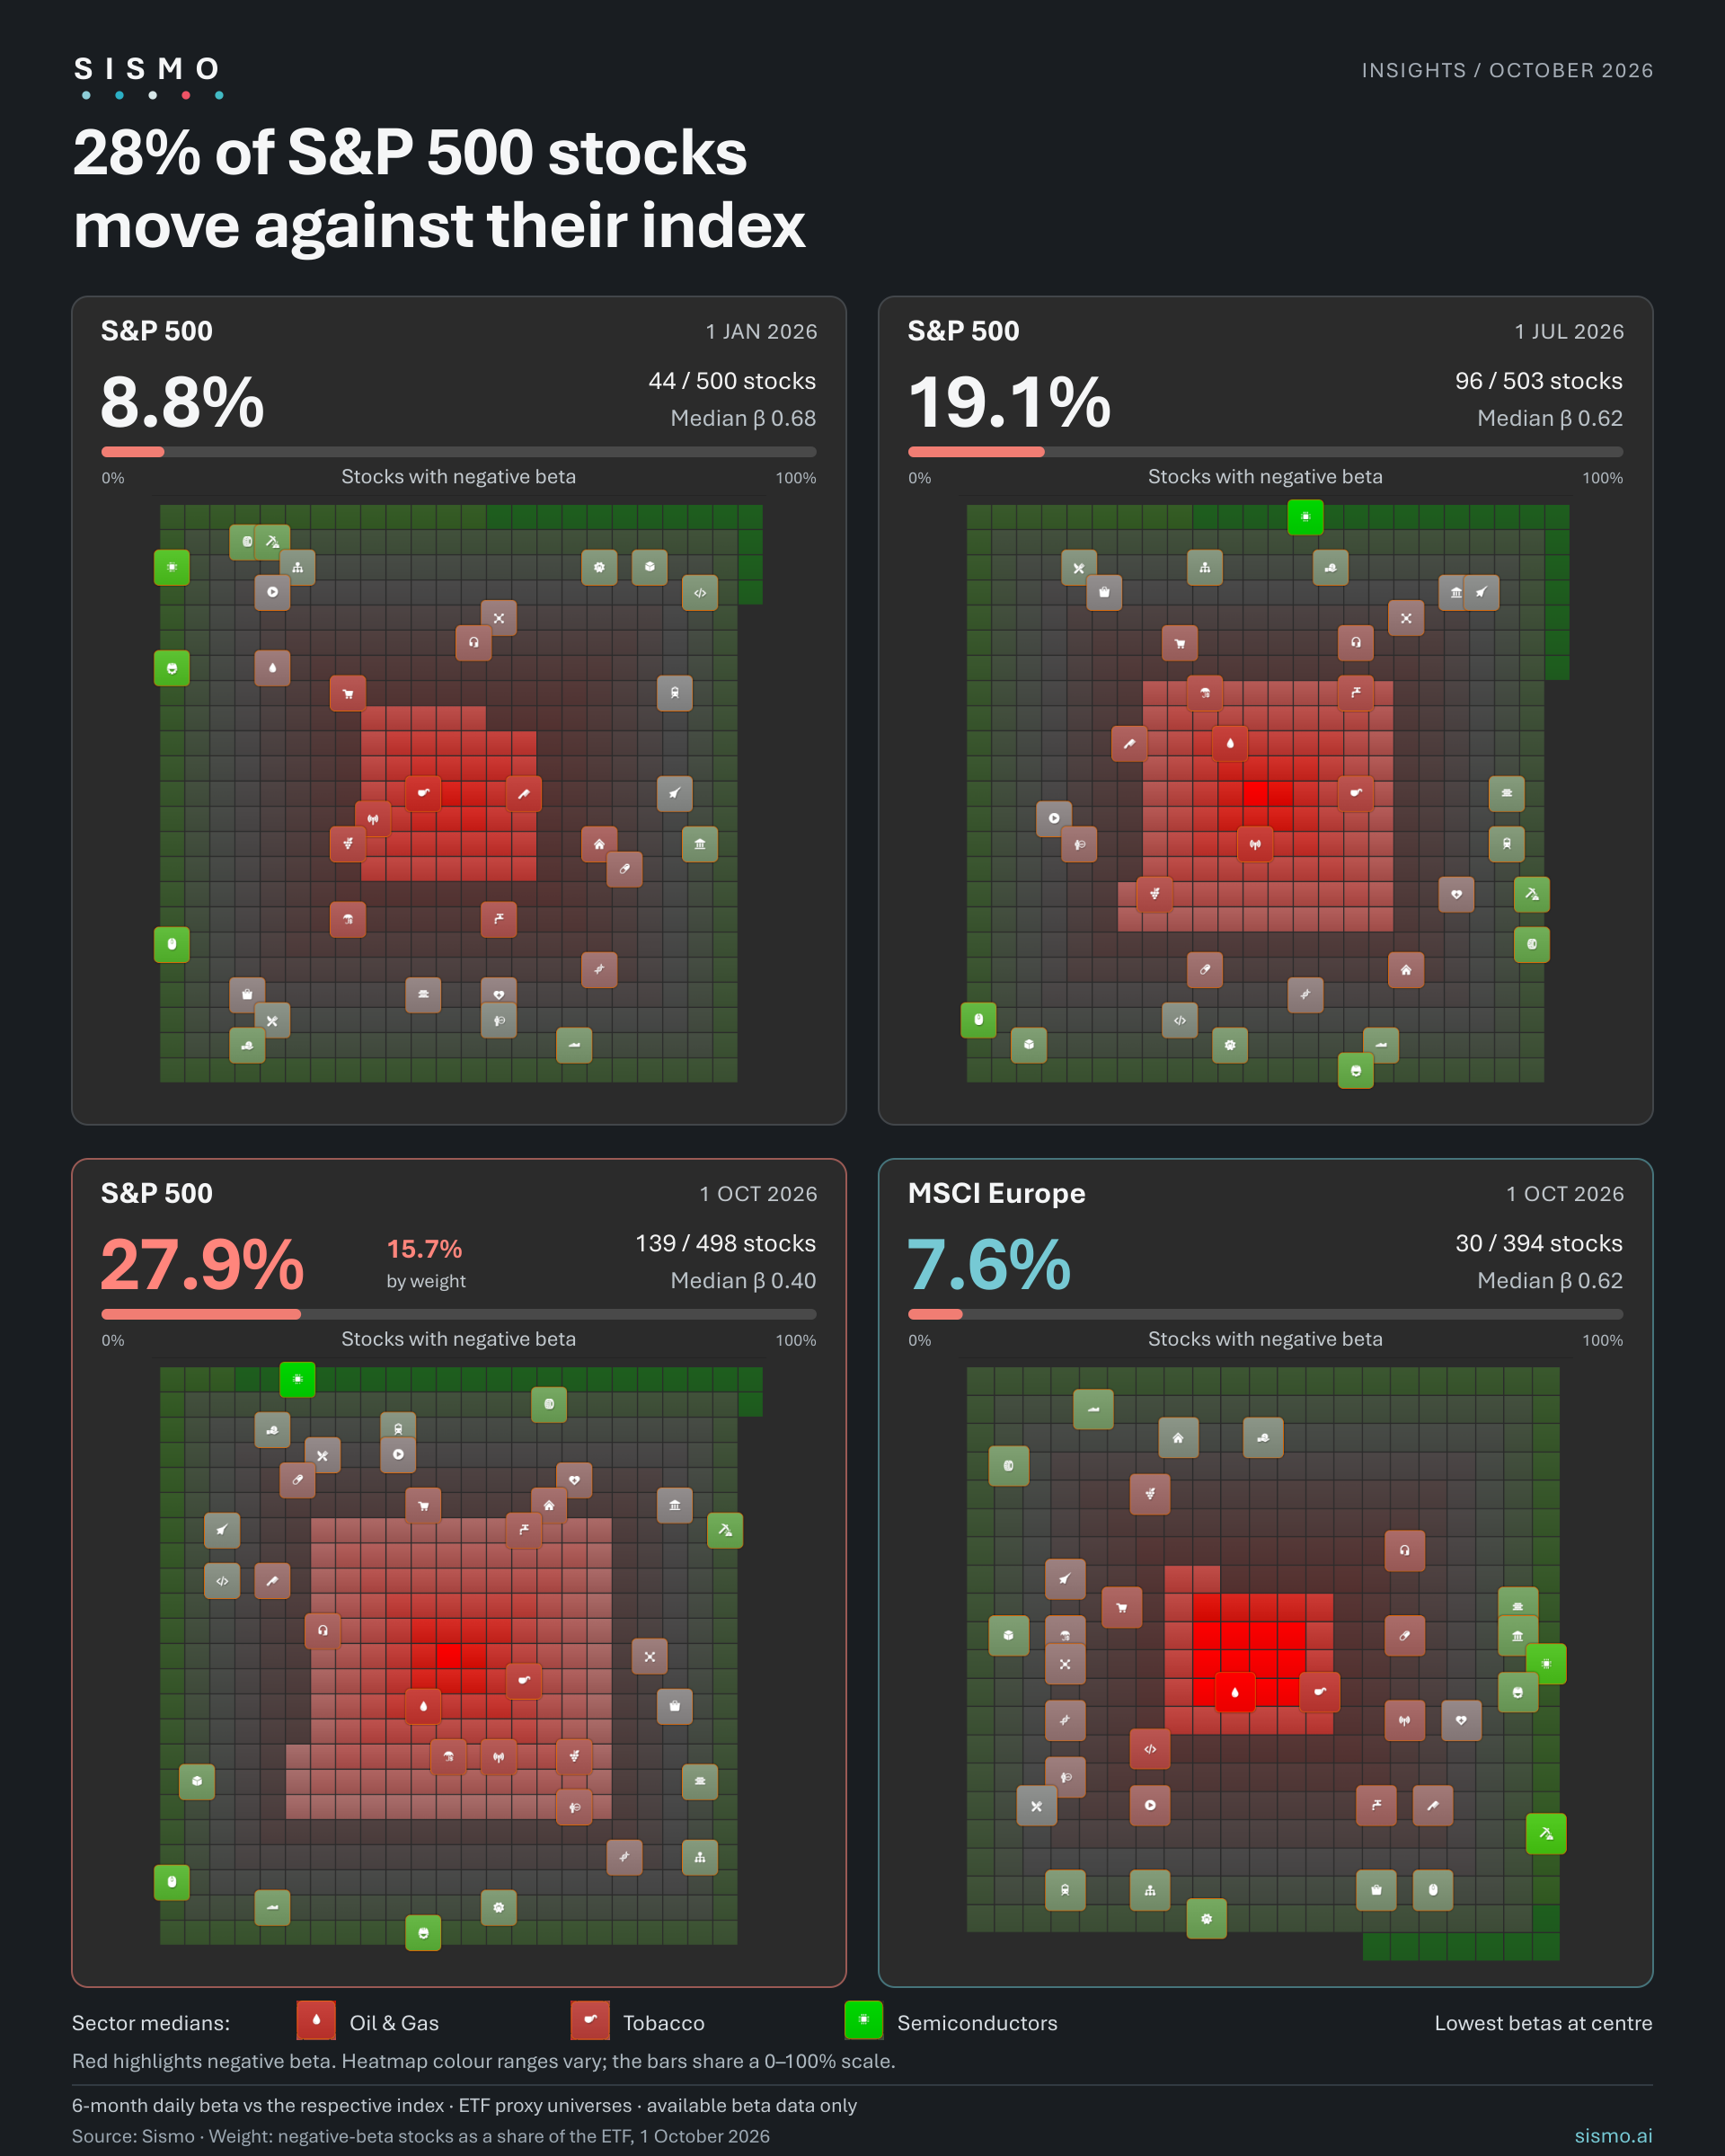
For the past few years, a handful of mega-caps, from the Magnificent Seven to the broader AI investment theme, have pulled the S&P 500 ahead of much of the field.
The gap now extends beyond performance. An increasing number of stocks show a negative relationship with the index’s daily movements.
Sismo calculated six-month betas using daily returns against the S&P 500, for stocks held in an ETF tracking the index. The proportion with a negative beta rose at each of the three dates examined:
The proportion has more than tripled in nine months. Over the same period, the median estimated beta fell from 0.68 to 0.40.
A negative beta means that daily stock returns and daily index returns were negatively related over the observation window. It does not mean that the stock necessarily lost money over the six months, or moved against the index every day.
A Goldman Sachs chart, as reported in the financial press, showed approximately 45% of S&P 500 stocks with a negative three-month beta, the highest reading since at least 1990. The shorter window produces a different reading, but both analyses point to a substantial share of stocks moving against their benchmark.
On 1 October, the 139 negative-beta stocks represented 27.9% of the stocks analysed but only 15.7% of the ETF’s total weight.
The distinction matters. Nearly three stocks in ten had a negative beta, but together they accounted for less than one-sixth of the portfolio. Their influence on the ETF therefore differs considerably from their share of the stock count.
On 1 October, eight sector groups had a negative median stock beta to the S&P 500:
The estimates ranged from −0.75 for Oil & Gas to just below zero for IT Services. Food & Drug Retail and Real Estate were slightly positive, at 0.03 and 0.04. Individual examples included APA at approximately −1.5 and CF Industries at −1.3.
At the other end, sector medians reached 2.70 for Semiconductors, 1.94 for Technology Hardware, 1.81 for Construction & Engineering and 1.46 for Metals & Mining.
The difference between the highest and lowest sector medians exceeded 3.4 beta points within the same US universe. These are medians of individual-stock betas: they describe the typical stock in each group, rather than the beta of a sector portfolio.
The same calculation for an MSCI Europe ETF proxy, with each stock measured against the MSCI Europe, produced a much smaller proportion.
On 1 October, 30 of 394 stocks analysed had a negative beta - 7.6% - and the median beta was 0.62. Both figures were closer to the US readings in January than to those in October.
Concentration is one possible explanation for the difference. The largest companies have the greatest influence on a capitalisation-weighted index’s daily return. Other constituents may respond differently to interest rates, commodity prices or shifts in investment spending, leaving them with a low or negative beta to that benchmark.
The figures do not establish how much of the US–Europe difference comes from concentration, sector composition or other factors. Nor does Europe’s resemblance to the January US readings imply that it will follow the same path.
For active managers, the sector split helps explain how portfolios drawn from the same stock universe can behave very differently. A broad spread of holdings does not necessarily reproduce the benchmark’s sensitivities. Position sizes matter as much as the list of names.
For diversification, negative betas identify historical relationships worth examining more closely. Their persistence and statistical reliability matter, particularly when estimates sit near zero. They do not guarantee protection during the next market decline.
For index investors, 15.7% is the useful counterpart to the 27.9% headline. The number of stocks moving against the benchmark is substantial; their portfolio weight is much smaller. Understanding their effect requires looking at both their weights and their sensitivities.
Sismo lets investors examine these relationships by stock, sector and portfolio, and compare them across dates.
Methodology: Sismo calculations using equity holdings from ETFs tracking the S&P 500 and MSCI Europe as proxies for their respective index universes. Betas use daily returns over the preceding six months against the corresponding index. Stock percentages use constituents with available estimates at each date. The 15.7% figure is the sum of ETF weights of negative-beta stocks on 1 October 2026. Sector figures are medians of individual-stock betas within Sismo’s sector classification. Universe membership and data coverage may vary between dates. Historical estimates are not forecasts. Goldman Sachs figures as reported by CNBC (28 September 2026).
.png)