When everything seems to be falling at once, identifying what’s truly under pressure - and what still appears to hold some ground - can be informative.
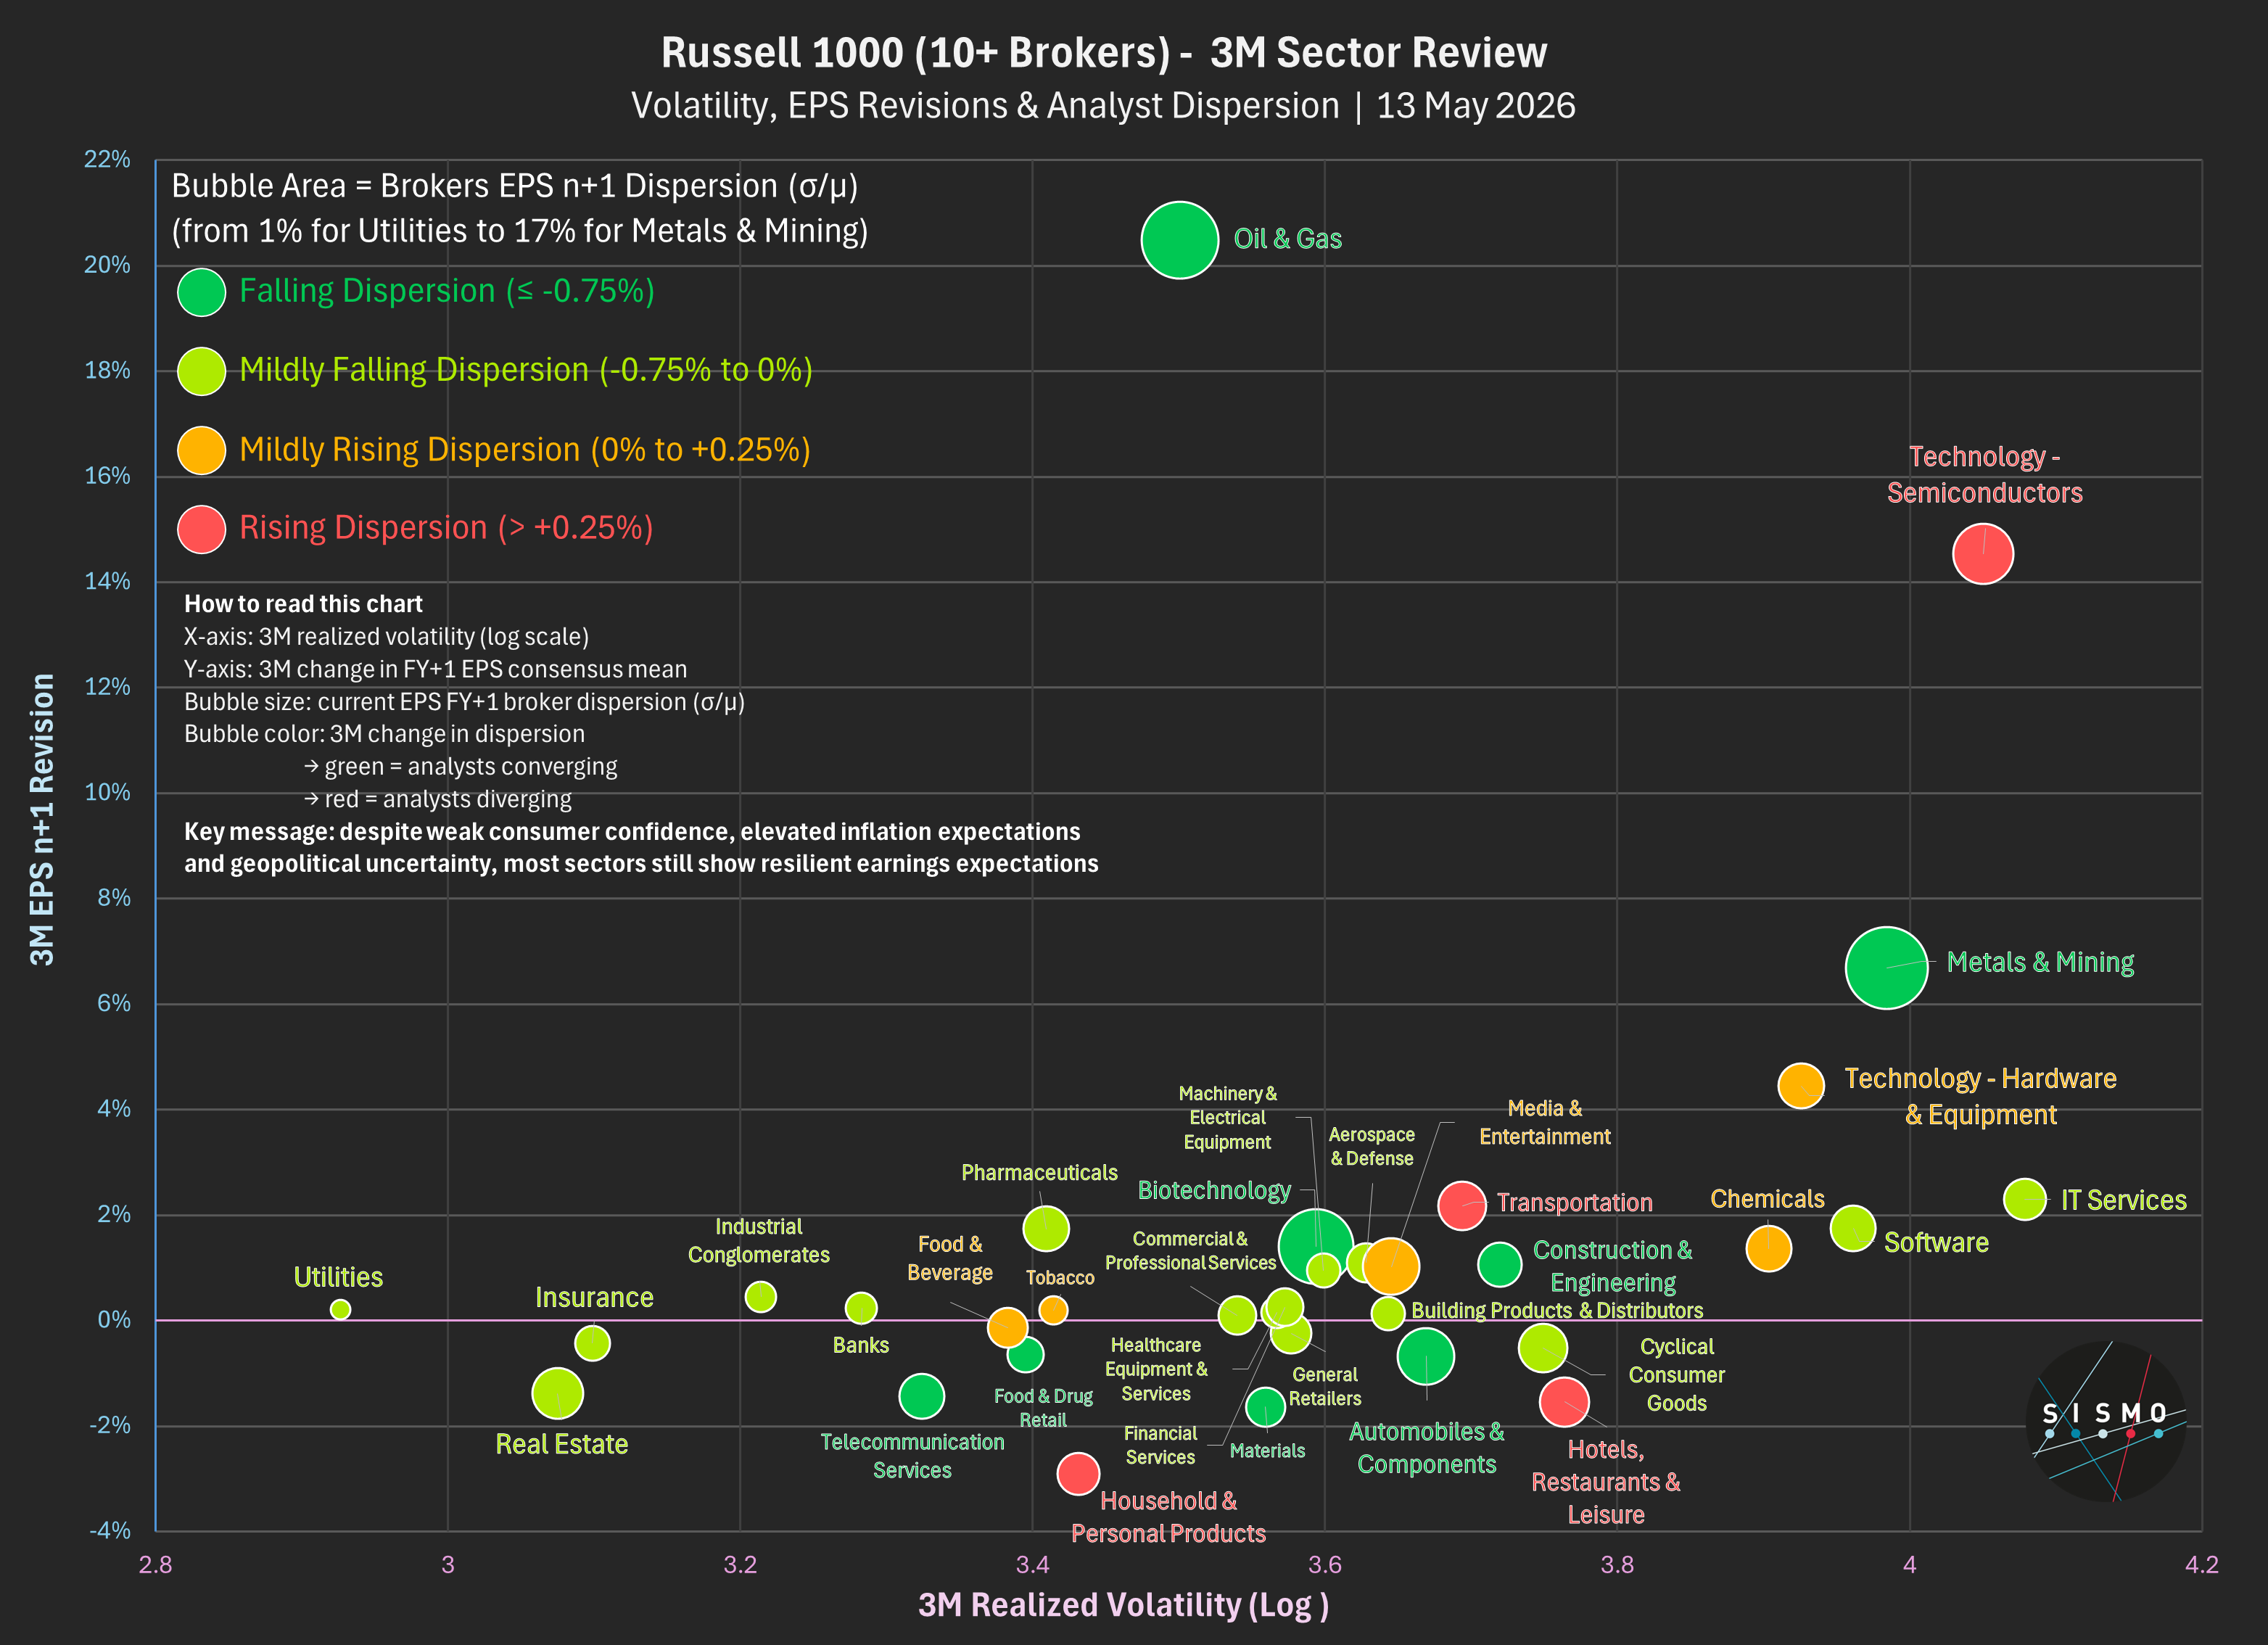
Let’s have a look at what happened last week across global equities. Using Sismo’s analysis of MSCI World large caps, we focused on three indicators:
We grouped stocks by sector (33 categories) and by country (France, Germany, UK, US, Japan, China), analyzing median values.
Overall results across the universe:
By sector: The surge in trading activity wasn't random. It concentrated in sectors either under significant pressure:
Or heavily traded due to renewed attention:
By country:
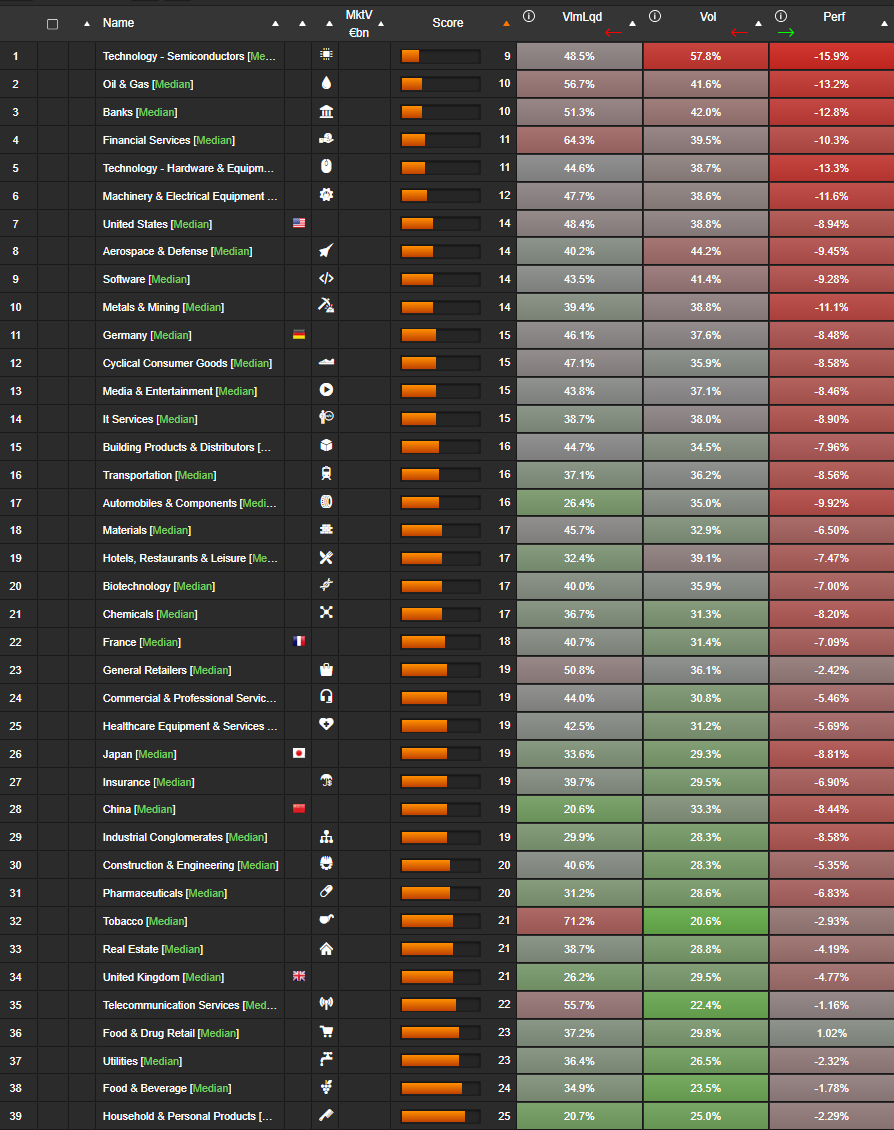
We then combined the three metrics into a composite stress score (out of 30), where a lower score indicates higher market stress - driven by a mix of heavy trading, high volatility and weak returns.
Most stressed sectors:
Most resilient sectors:
Country-level scores (lower = more stress):
United States (14), Germany (15), France (18), Japan (19), China (19), UK (20)