Over the past month, we’ve observed a striking asymmetry in S&P 500 trading behavior:
• Stocks that underperformed experienced massive turnover and volume surges
• Defensive and resilient names traded in relative silence
This is not broad-based rotation – it’s selective repositioning.
The most heavily traded stocks over the past month tend to be those most exposed to tariff risk and recent macro headlines.
Meanwhile, many of the best-performing names have shown little increase in trading activity.
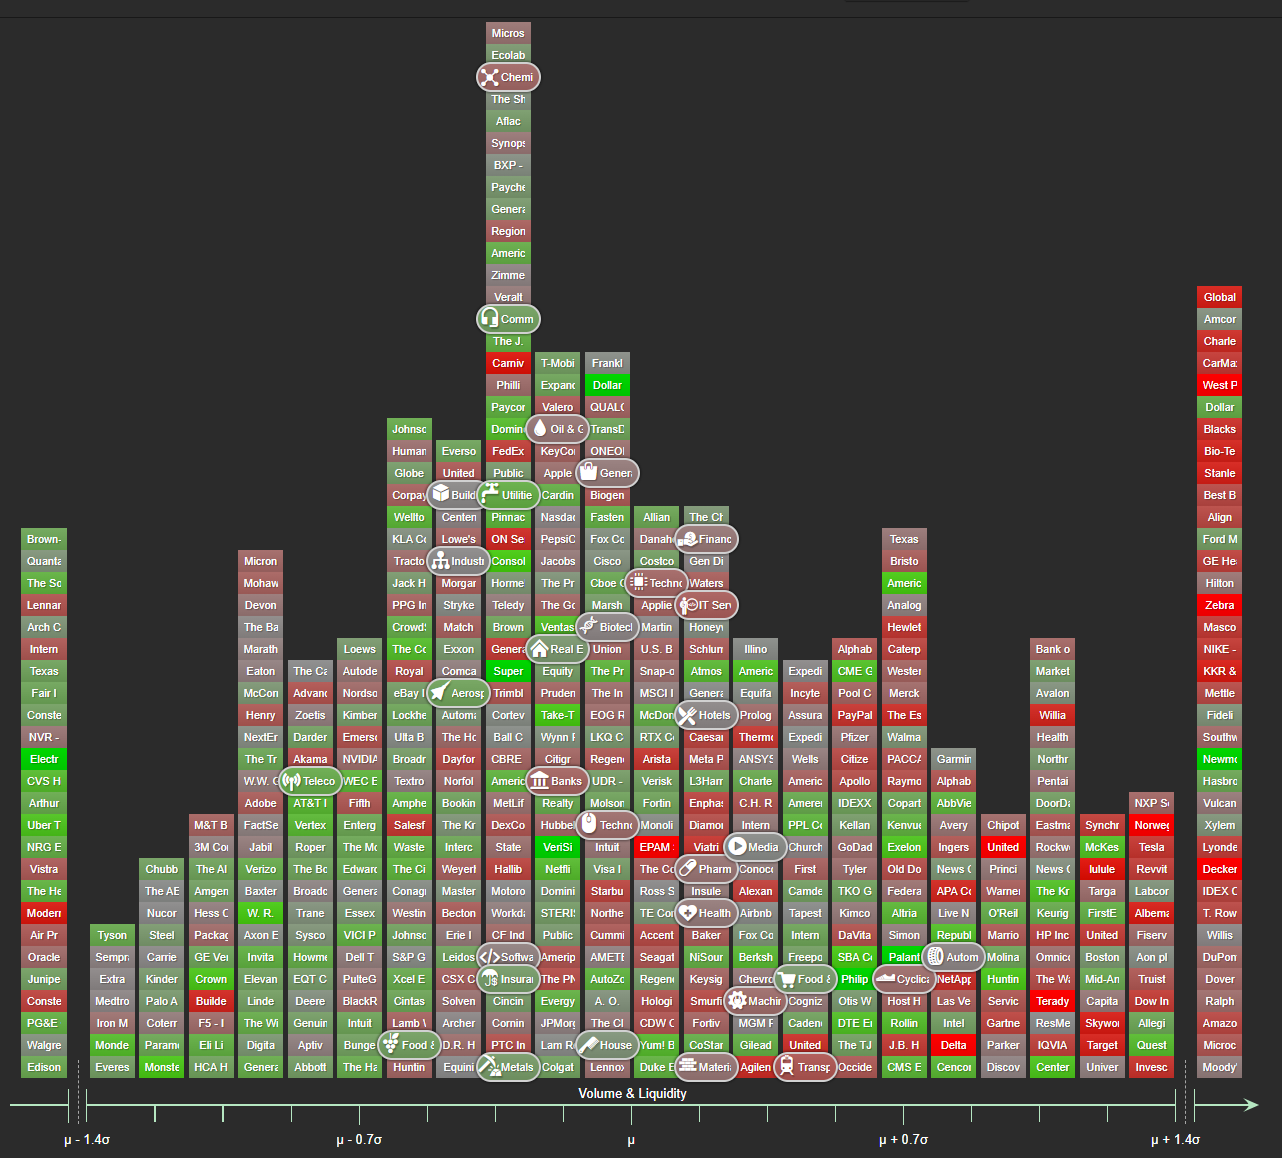
What we measured:
• % change in cumulative trading volume over the last month (since Trump’s “liberation day”) vs. one month of volume from three months ago, displayed left to right on the horizontal axis.
• 3-month total return centered on the S&P 500 average, shown by color, from red (underperformance) to green (outperformance).
The red and green tiles in the chart represent this relationship clearly: as a general pattern, volume surged where performance was weakest.
Example: Nike
-25% total return over 3 months
+141% increase in trading volume in the last month compared to 3 months ago
Nike is just one of many high-profile names experiencing this dynamic, particularly among global importers and consumer brands sensitive to tariffs.