Brent’s volatility has more than doubled since the Iran war began on 28 February. For most euro-area small caps, oil remains a small risk. For a growing group of airlines and travel names, landlords and consumer brands, it now explains a sizeable share of what the market does not. The shift shows in how much of their risk oil explains, not in the size of their oil betas.
Brent futures settled at $116.72 on Friday 23 October, a six-month high. In the Europe spot series used for our analysis, Brent peaked at $138.21 on 7 April, and the standard deviation of its daily moves rose from 1.8% to 4.2%, or from 29% to 66% annualised, between the six months to 27 February, just before the war, and the six months to 21 October.
We ran Sismo’s two-factor regressions on the 373 holdings of an ETF tracking the MSCI EMU Small Cap index, used as a proxy for the index: each stock’s daily return against the index and Brent. The number of stocks that lose when oil rises and for which oil explains more than 5% of return variance beyond the index has tripled, from 7 to 22. Air France-KLM is the clearest case: its oil beta is about the same as before the war, but oil now explains 12.3% of its return variance, against 2.9%.
For the median stock, oil is still a minor risk: it explains 0.7% of return variance beyond the index, against 0.5% before the war. The change is in the tail. Our reading is that oil has switched from a growth signal to a cost shock: through 2025 the median stock tended to rise with oil; since early 2026 most stocks fall with it.
Measuring oil risk when oil gets more volatile
Chart 02 shows both halves of the problem. Brent’s volatility more than doubled with the war (top). The median oil beta, the stock’s return for a 10% rise in Brent with the index held constant, turned negative and stayed small (bottom).
For the median stock, oil-driven volatility measured this way rose from 2.0% to 3.0% annualised between the six months to 27 February and the six months to 21 October. But medians mix signal with estimation noise. With six months of daily data, a stock with no real link to oil still shows a non-zero beta, and that noise alone would put the median oil-driven volatility at about 1.7%, in both periods. Before the war, the median was barely above that floor; it is now clearly above it. The noise in each beta also shrinks as oil becomes more volatile, so comparing the typical size of betas across a calm and a volatile period says more about measurement than about economics.
Statistical significance separates the two. The table compares what we observe with what noise alone would produce.
| Measure | To 27 Feb 2026 (before the war) | To 21 Oct 2026 | Noise alone |
|---|---|---|---|
| Stocks with a statistically clear oil link (|t| above 2) | 12% | 20% | about 5% |
| Stocks with a strong oil link (|t| above 2.6) | 5% | 10% | about 1% |
| Stocks that lose when oil rises, with ΔR² above 5% | 7 | 22 | 1 to 2 |
| Median oil-driven volatility (beta size × Brent volatility) | 2.0% | 3.0% | about 1.7% |
The signal is in the tail. The share of stocks with a clear link to oil has nearly doubled, and the number with a strong negative one has tripled. For those stocks, oil now explains a material part of what the index does not.
Who is exposed
The 22 stocks fall into four groups: airlines and travel (5), property and housing (7), consumer and luxury brands, including two French fragrance companies (5), and energy-intensive industrials and materials such as Wienerberger, Vidrala, Pirelli and KION (4), plus one bank. The table gives the same three measures for the names discussed below, before the war and now.
| Company | Return for +10% Brent, Feb → Oct | ΔR², Feb → Oct | Oil-driven volatility, Oct |
|---|---|---|---|
| Airlines, airports and travel | |||
| Air France-KLM (France) | −2.76% → −2.27% | 2.9% → 12.3% | 15.0% |
| Finnair (Finland) | −0.75% → −1.94% | 0.3% → 7.7% | 12.8% |
| TUI (Germany) | −2.18% → −1.33% | 3.8% → 6.5% | 8.8% |
| Fraport (Germany) | −0.58% → −1.31% | 0.4% → 7.7% | 8.7% |
| Property | |||
| VGP (Belgium) | −1.34% → −1.21% | 3.2% → 7.2% | 8.0% |
| TAG Immobilien (Germany) | −1.22% → −1.18% | 1.9% → 6.0% | 7.8% |
| LEG Immobilien (Germany) | −1.72% → −0.93% | 5.0% → 5.4% | 6.1% |
| Carmila (France) | −1.44% → −0.58% | 6.4% → 5.0% | 3.8% |
| Fragrance | |||
| Interparfums (France) | +1.14% → −1.34% | 1.1% → 7.7% | 8.8% |
| Robertet (France) | +0.32% → −0.92% | 0.2% → 8.5% | 6.1% |
| Oil producers and services, for contrast | |||
| Maurel & Prom (France) | +4.74% → +2.14% | 13.0% → 15.4% | 14.1% |
| Vallourec (France) | +2.37% → +1.64% | 7.2% → 7.1% | 10.8% |
| Median stock | −0.28% → −0.22% | 0.5% → 0.7% | 3.0% |
Airlines and travel: already exposed, now more so. Air France-KLM and TUI already lost ground when oil rose before the war. Their betas have not grown, but their correlation with oil has: from −0.17 to −0.40 for Air France-KLM, whose oil-driven volatility rose from 8% to 15%. Finnair and Fraport went from little sensitivity to a clear one.
Property: a recurring sensitivity, now at its strongest. All 25 property stocks in the universe now fall when oil rises, index held constant; 96% already did in the six months to February. German and Belgian landlords such as TAG Immobilien and VGP now carry the most oil risk, while French retail landlords such as Carmila carry less than before the war. This is consistent with oil being read through inflation and rate expectations, the channel that matters most for leveraged real assets.
Fragrance: a market channel rather than a cost channel. Interparfums and Robertet went from a positive oil beta before the war to a clearly negative one. Neither mentions oil or petrochemical input costs in the 2026 results releases we reviewed. The more likely link runs through the Middle East. Interparfums said the war there hit tourist flows and store traffic in the region in the first half, and Robertet cites new Middle Eastern players among the drivers of its perfumery business. When oil jumps on escalation in the Gulf, that business is what is at stake. Other consumer brands in the group, such as Brunello Cucinelli and Rémy Cointreau, may share that channel; we have not reviewed their disclosures. This is our reading, not a result of the regressions.
Oil producers and services such as Maurel & Prom and Vallourec sit at the other end of chart 03: their link to oil is strong, positive, and not new.
Why the sign flipped: from growth signal to cost shock
Through 2025, the median stock tended to rise with oil, index held constant: +0.35% for a 10% rise in Brent in the six months to August 2025 (chart 02). Cyclical sectors led, with positive median oil betas in construction, machinery, autos, financial services and media. When oil rises because global demand is holding up, cyclical companies rise with it.
In the six months to February 2026, all five of those sectors turned negative, and 61% of stocks then had a negative oil beta, against 34% to 48% in the three earlier windows. That window was calm, with only two daily Brent moves beyond ±5%, so this first shift is weakly estimated (median ΔR² of 0.51%). The war has since made oil a supply shock, a cost for most companies rather than a sign of demand, and 67% of stocks now carry a negative oil beta. The sector pattern supports this reading, but the regressions do not prove it.
French property: oil and the sovereign spread
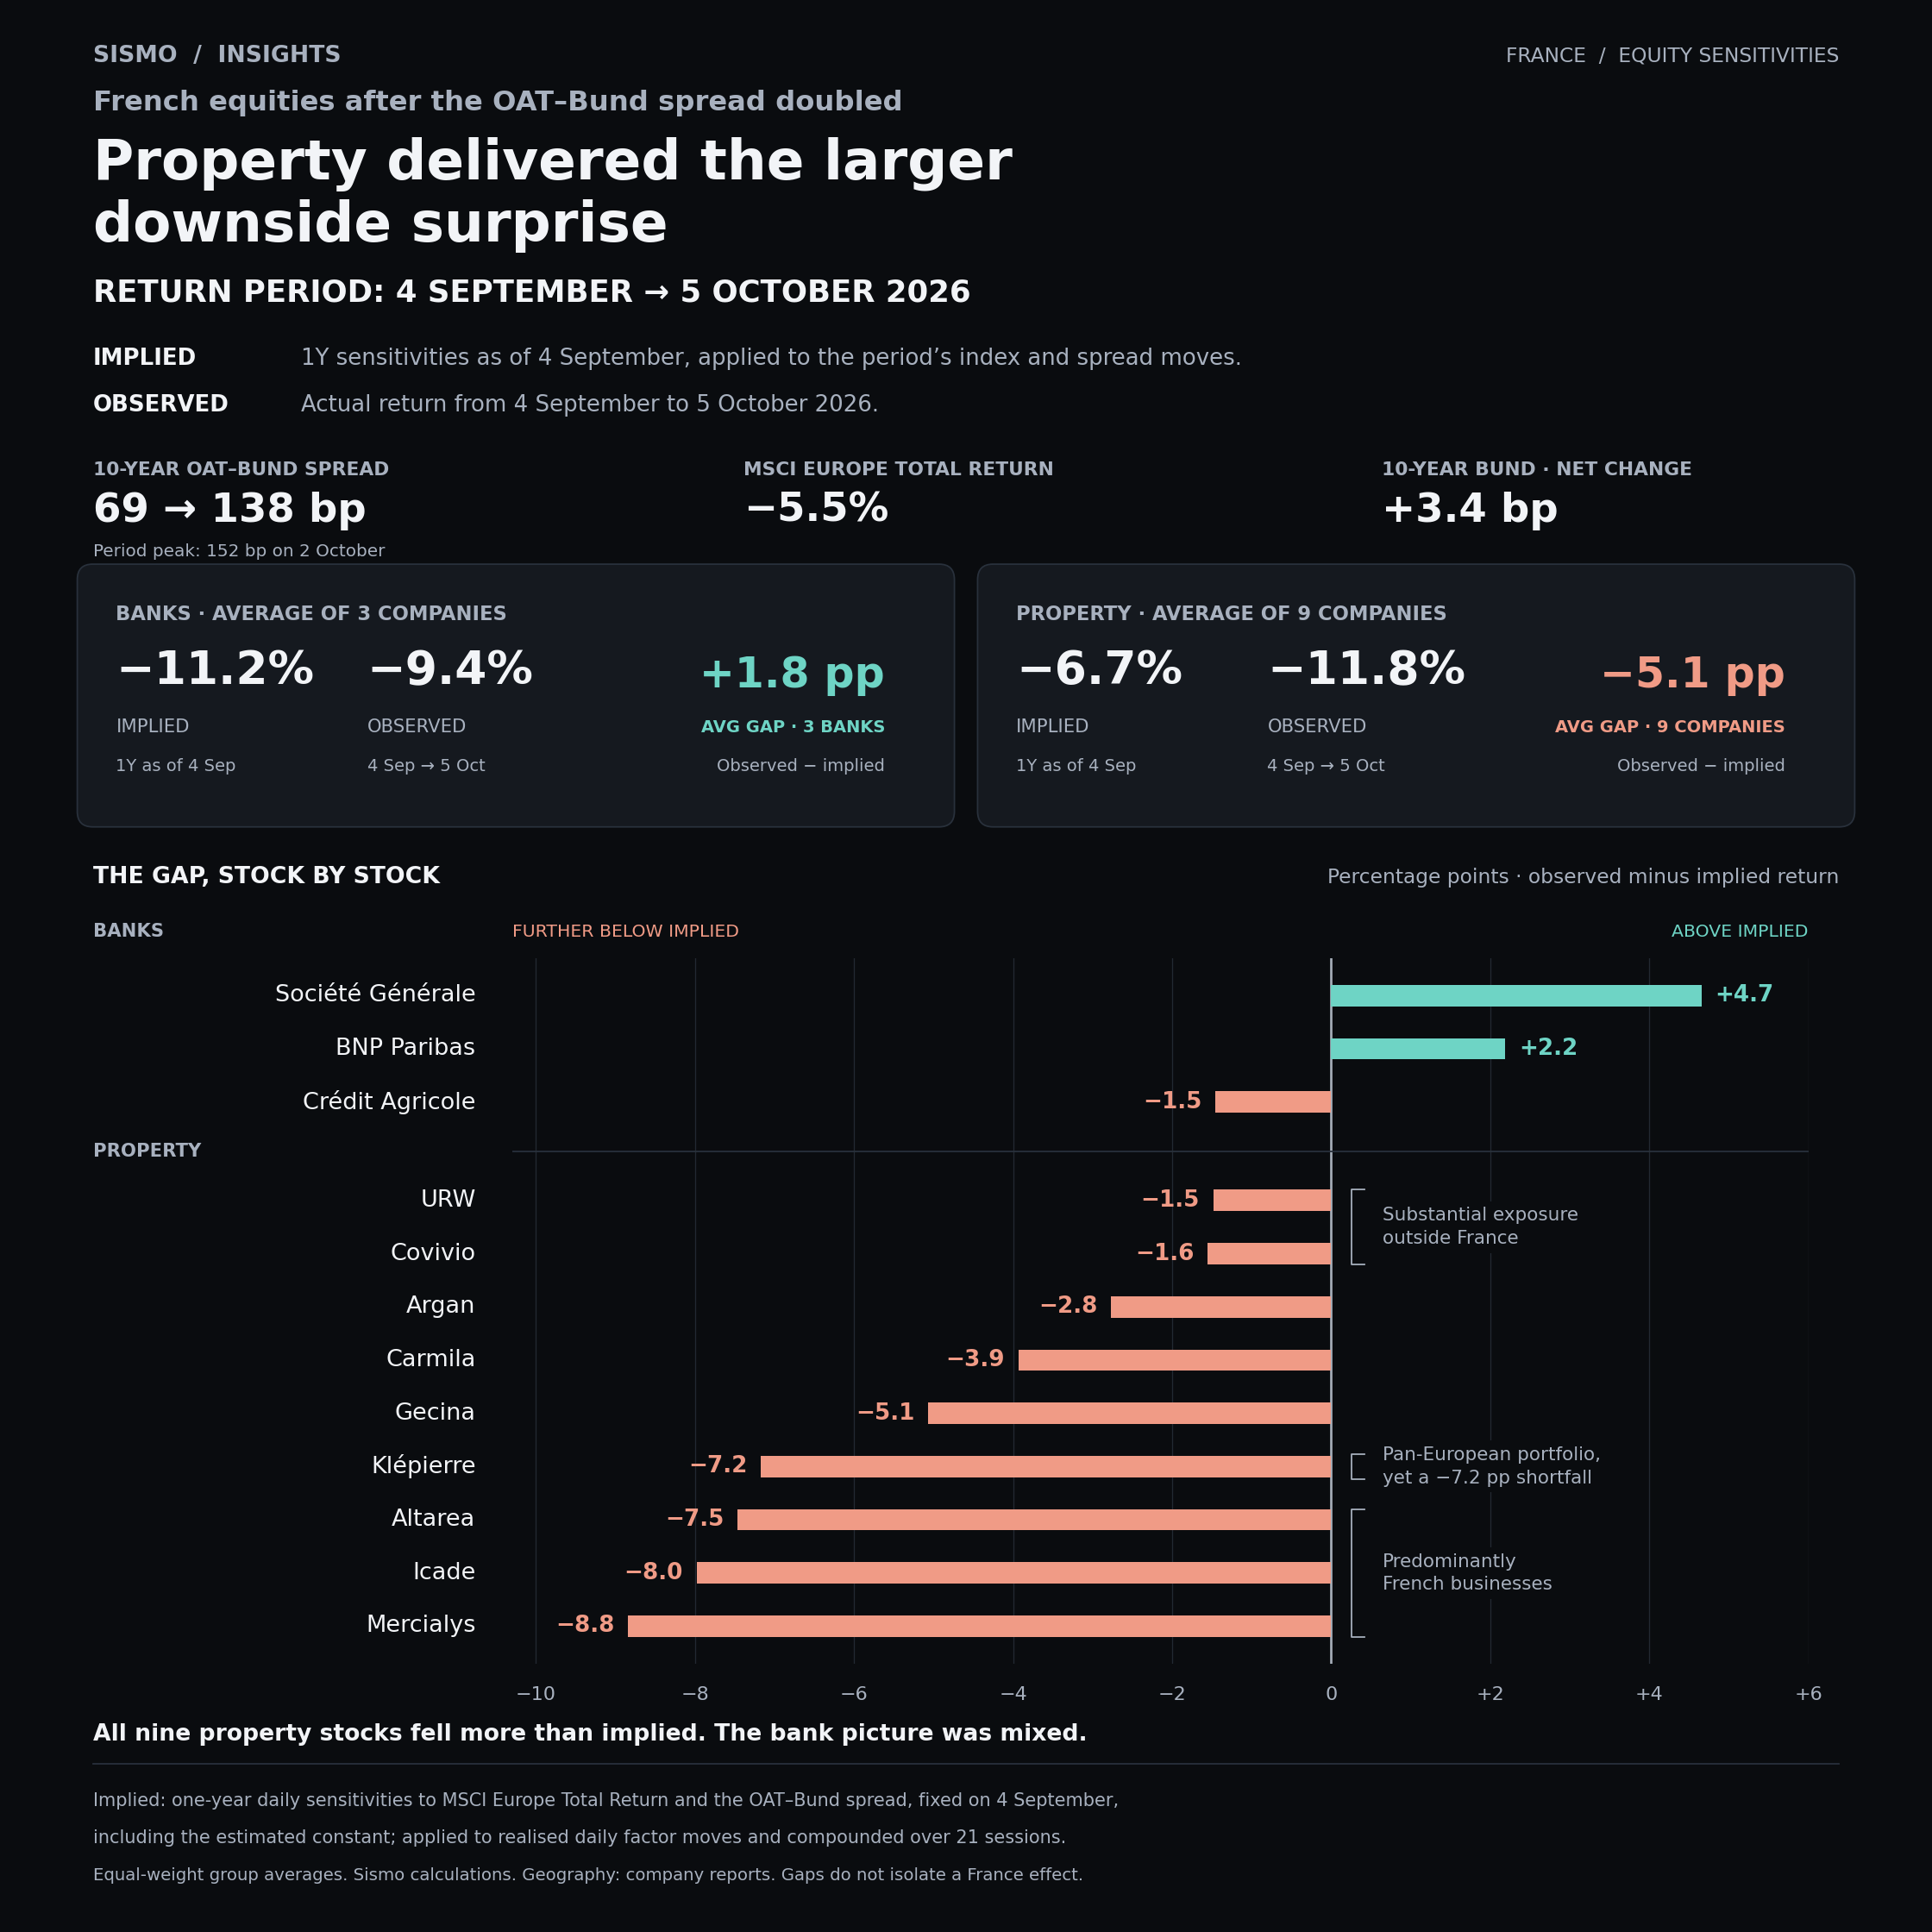
French property names carry a second macro risk. The France–Germany 10-year spread averaged about 0.75% over the past two years in Sismo’s series, then jumped from mid-September to near 1.6% on 21 October.
Across French small caps the spread link is common but small: over two years, 81% have a negative spread beta, but the median ΔR² is only 0.13%. French property is the exception, and the mechanism is the same as for oil. As the spread moved far more than usual, the return per basis point fell while the share of variance the spread explains rose. For Mercialys, the return for a 10 bp widening went from −2.35% to −1.08% between the six-month windows to 31 August and 21 October, while its ΔR² rose from 5.3% to 10.9%. Icade (7.6%) and Carmila (5.3%) also show a high spread ΔR². German property, which also fell with the spread until August, has since decoupled: LEG Immobilien’s spread ΔR² is back to 0.1%.
These six-month estimates rest on a few weeks of trading. Over two years, the spread explains 1.6% to 2.7% of the variance of these three French landlords, a steadier read. Carmila and Mercialys therefore carry both risks at once: oil and the sovereign spread.
What it means for portfolio managers
- Judge oil risk by beta times oil volatility, not by beta alone. When oil’s volatility doubles, an unchanged beta means twice the oil-driven risk. Air France-KLM’s beta is about the same as before the war, yet its oil-driven volatility rose from 8% to 15%.
- Rank exposures by ΔR², not only by beta. Air France-KLM’s beta is about the same as in February, yet oil now explains four times more of its moves. The beta says how much a stock reacts; ΔR² says how much of its risk that reaction represents.
- Look at the tail, and check significance. For the median small cap, oil is still a minor risk, and with six months of data small betas are mostly noise. The change is concentrated in about twenty names that lose when oil rises: airlines and travel, property, consumer brands and a few energy-intensive industrials. Property in particular is an oil holding: hedging a portfolio’s oil risk through energy and transport alone misses it.
- French property stacks two macro risks. Oil and the OAT–Bund spread hit the same names. Size those positions on the two-year spread estimates: the six-month figures still rest on a few weeks of trading.
Discuss your portfolio’s macro exposures
Which holdings carry oil risk that their beta no longer shows, and which carry the French spread on top? Sismo helps investment teams examine these questions at stock and portfolio level.
Get in touch for a demonstration using your investment universe.
Request a demo →Methodology. Sismo analysis dated 21 October 2026. Universe: the 373 current holdings of an exchange-traded fund tracking the MSCI EMU Small Cap index, used as a proxy for the index; the fund’s holdings may differ from the index constituents. The universe is held constant at every date so that changes over time are not composition effects; counts per window vary slightly with price history (363 to 373 stocks for six-month estimates). Daily stock returns are regressed on an intercept, the MSCI EMU Small Cap index return and one macro variable: either the daily % change in Brent (Europe Brent spot price, FOB, FRED series DCOILBRENTEU) or the daily change in the France–Germany 10-year yield spread, in separate regressions. Windows of six months, two years and five years end on 27 February 2025, 29 August 2025, 21 October 2025, 27 February 2026, 31 August 2026 and 21 October 2026. The last Brent spot observation in the latest windows is 20 October 2026 ($115.22); the series carries it forward to 21 October. Stock returns are in decimals and yield changes in percentage points: beta × 10 gives the estimated return component in % for a 10% rise in Brent or a 10 bp widening of the spread, holding the index constant. ΔR² = R²(index + macro variable) − R²(index only), using the same observations, reported as a percentage of total return variance; the share of variance not explained by the index is ΔR² / (1 − R² of the index-only regression). By the Frisch–Waugh–Lovell theorem, the oil beta equals the partial correlation with oil times the ratio of the stock’s volatility to Brent’s, both net of the index; partial correlations are recovered from ΔR² and R², and oil-driven volatility = absolute beta × Brent volatility, with Brent’s total rather than residual volatility used as an approximation. Brent volatility is the standard deviation of daily % changes of the same series over each regression window, annualised by √252. t-statistics are derived from the partial correlation ρ as t = ρ√(n − 3)/√(1 − ρ²), with n ≈ 131 daily observations per six-month window. Noise benchmarks assume no true link to oil: |t| then approximately follows a standard normal distribution, and the median oil-driven volatility equals 0.674 × the standard error of the beta × Brent volatility, taken at the median across stocks. Sector figures are unweighted medians of stock-level metrics, not sector-portfolio regressions. ΔR² alone does not establish statistical significance. Brent and the spread rose together in September and October 2026 and are estimated separately, so part of their recent effects may overlap. These conditional historical estimates are not causal effects or forecasts.
Sources. Sismo, analyses dated 27 February 2026, 31 August 2026 and 21 October 2026, and one year earlier. Interparfums, first-half 2026 sales and results, as reported by ABC Bourse / Agefi-Dow Jones, 23 July 2026. Robertet, first-half 2026 results, 17 September 2026. Brent futures on 23 October 2026: CNBC, 23 October 2026. Brent spot: Europe Brent spot price, FOB, U.S. Energy Information Administration via FRED, DCOILBRENTEU. France–Germany 10-year spread: Sismo daily series.