Sismo is a visual analytics platform for equity investors, built to keep portfolios aligned with your strategy, highlight opportunities, and expose hidden risks.
It combines powerful data visualization with factor-based diagnostics for faster, clearer decisions.
No black box.

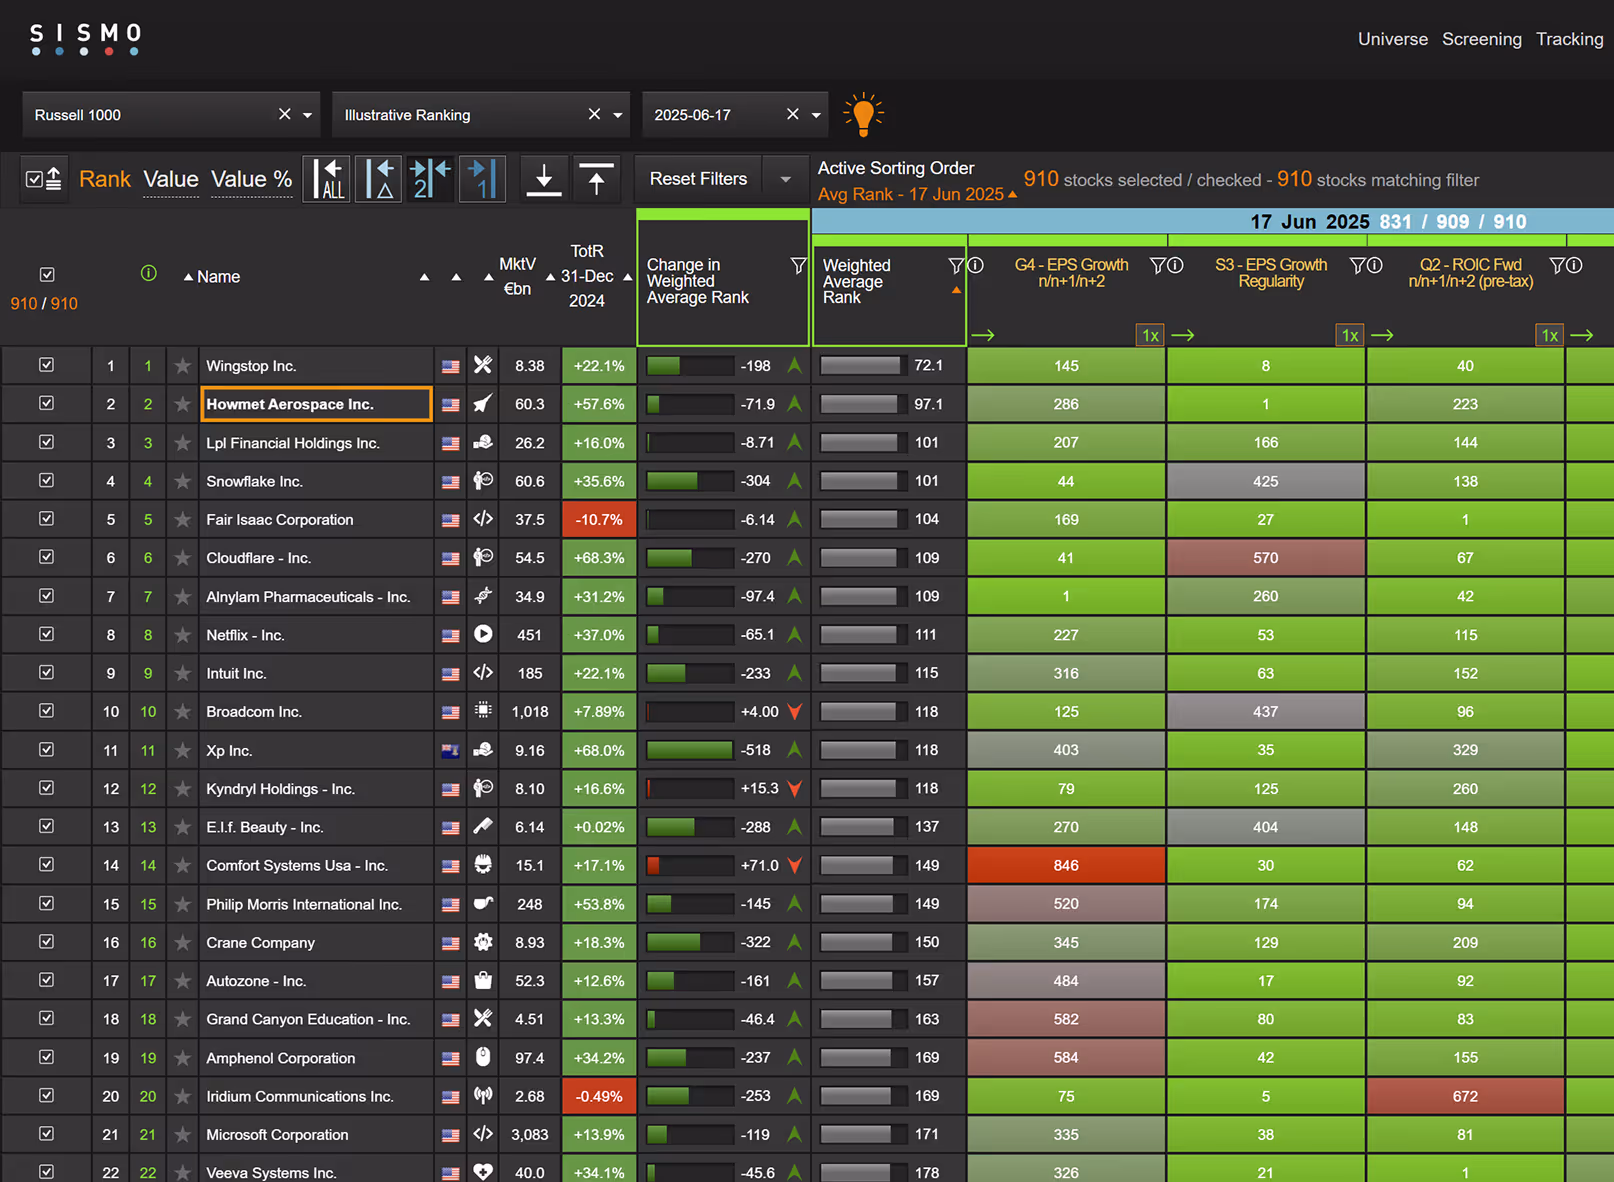
You build portfolios from deep conviction. Sismo helps you sharpen your process without changing your style.
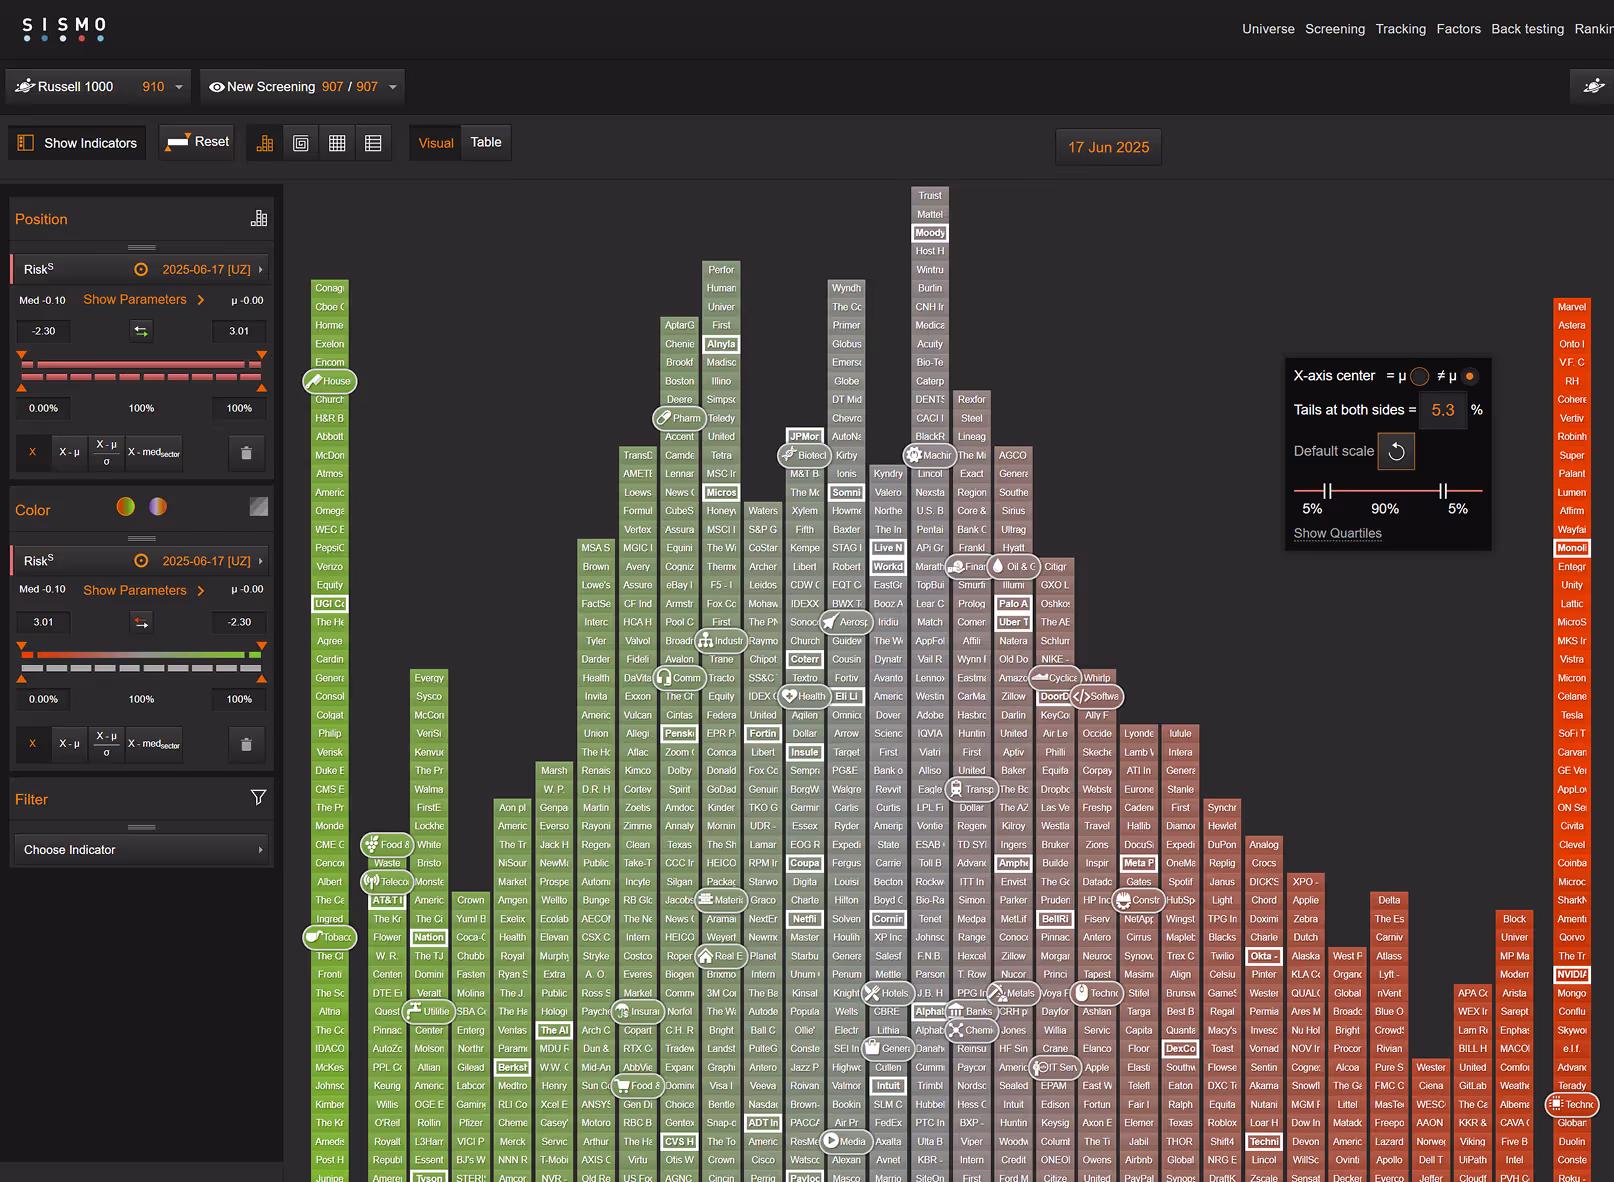
Sismo helps you see what’s driving portfolio risk - clearly and continuously.
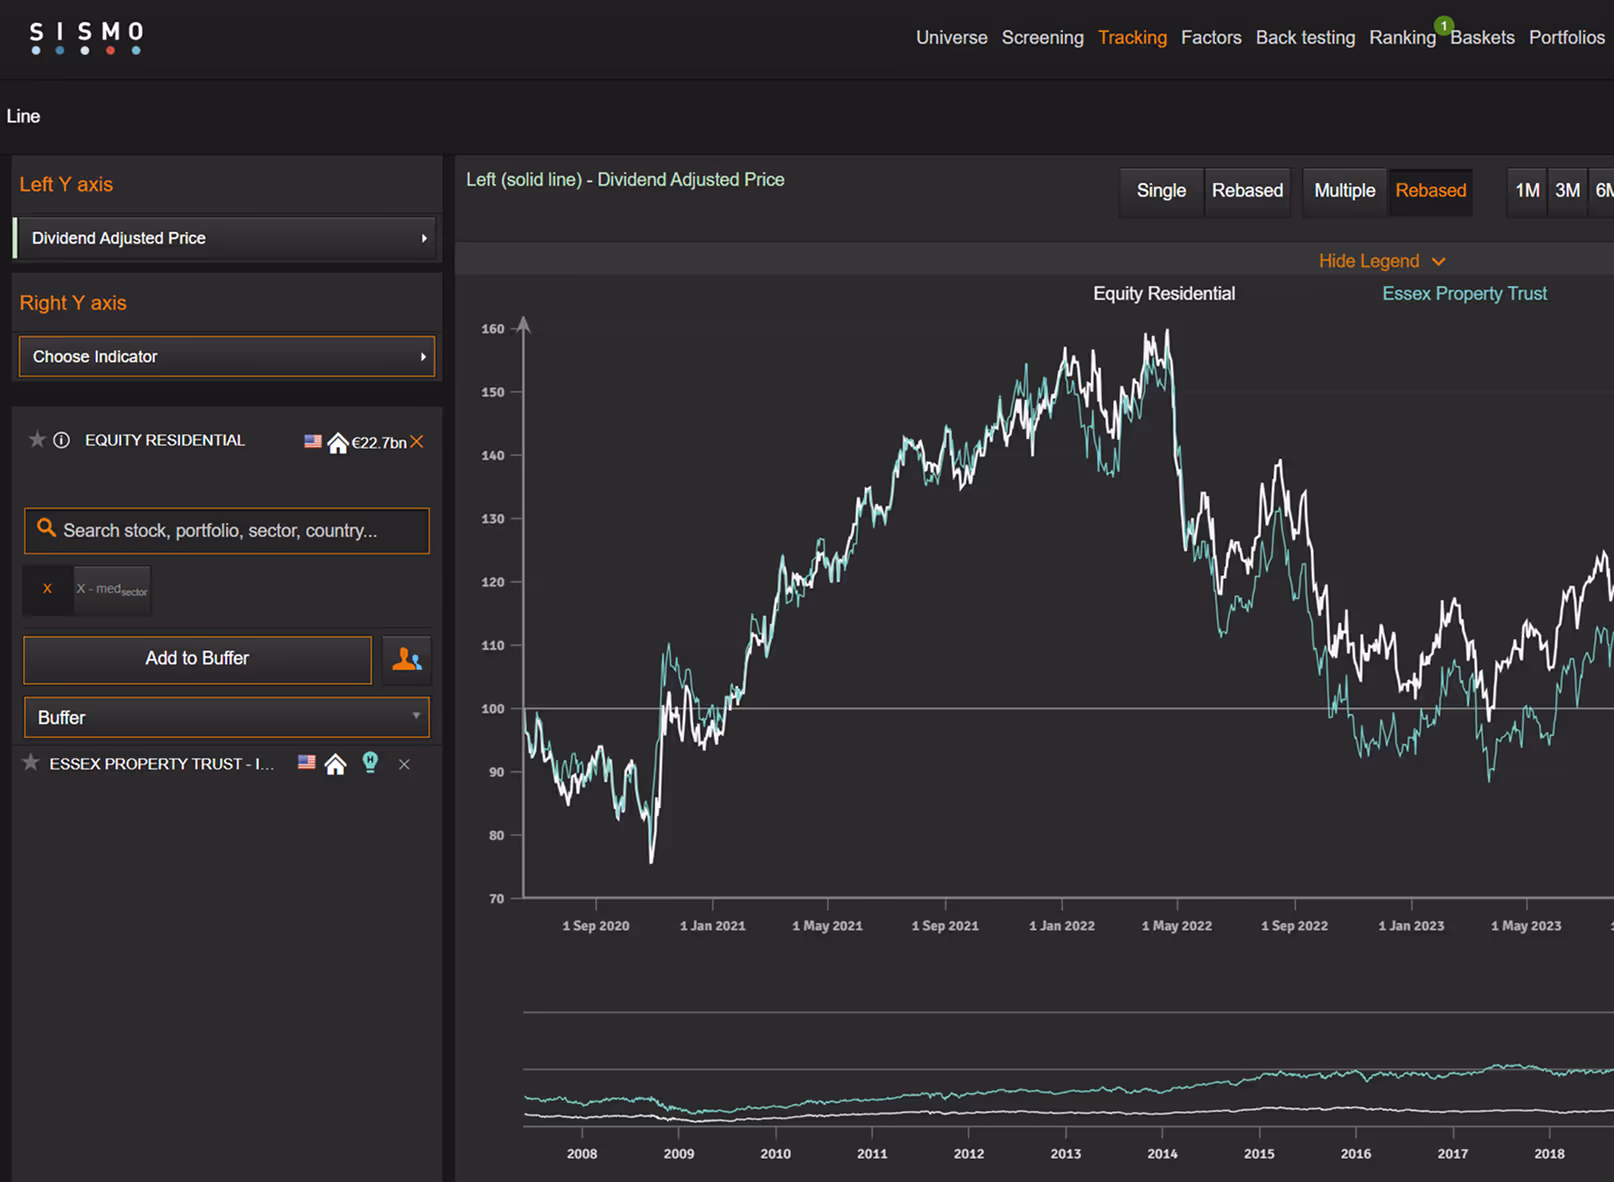
Sismo gives IR teams the tools to benchmark, anticipate investor questions and communicate with clarity - using the same language investors use.
Our investment team uses Sismo almost daily - both to expand our investment universe and to make the most of it in managing our funds. We haven’t found anything comparable on the market.”
Sismo is a key part of our risk management framework. It helps us monitor evolving risk drivers, detect style drift and assess macro sensitivity - all with clear visuals and customizable factors.”
We rely on fundamental analysis and Sismo helps us deepen our understanding of portfolio risk through factor analysis. The tool is powerful, intuitive, and handles large datasets with ease.”
With Sismo, you get the clarity and power of a top-tier platform - without the overhead. It’s fast to deploy, easy to use, and built to deliver value from day one.
One license. Full access. No surprises.
What’s included
Sismo includes built-in access to global equities, financial history, market data and sell-side estimates via S&P Capital IQ - plus macroeconomic series from the Federal Reserve Economic Data (FRED).
Yes - Sismo lets you upload your own data directly through the interface or via automated API. You can add portfolios, indices, stock universes, time series linked to individual stocks (e.g., proprietary indicators, broker data) and macroeconomic series. The API allows fully automated integration with no manual handling required.
No - Sismo places no limits on custom data. As long as your files include dates or security identifiers, they can be integrated seamlessly.
No - Sismo runs directly in your browser, fully compatible with Chrome and Edge. No installation or plugins required.
Absolutely - you can explore the platform using built-in data and tools. Uploading your own data is entirely optional.
Yes - every license includes tailored onboarding and live support to help you get the most out of Sismo.
Sismo is used by equity portfolio managers, analysts, investment teams and risk managers at asset and wealth management firms - primarily in Europe, with international expansion underway.
No - while Sismo is built to support fundamental workflows, it also serves quantamental teams, risk managers and strategy groups who need to visualize and compare equity signals.
Whether you're refining a portfolio, tracking risk, or preparing for investor meetings — Sismo gives you the clarity to go faster and stay aligned with your strategy.