This analysis examines how U.S. equity market concentration has evolved over the past 18 years using Sismo’s dynamic universes. By ranking all listed U.S. companies by market capitalization at each date, we can observe how the average size of firms in each segment has changed and how the dominance of the largest players has intensified - particularly since the acceleration of the AI revolution in 2023.
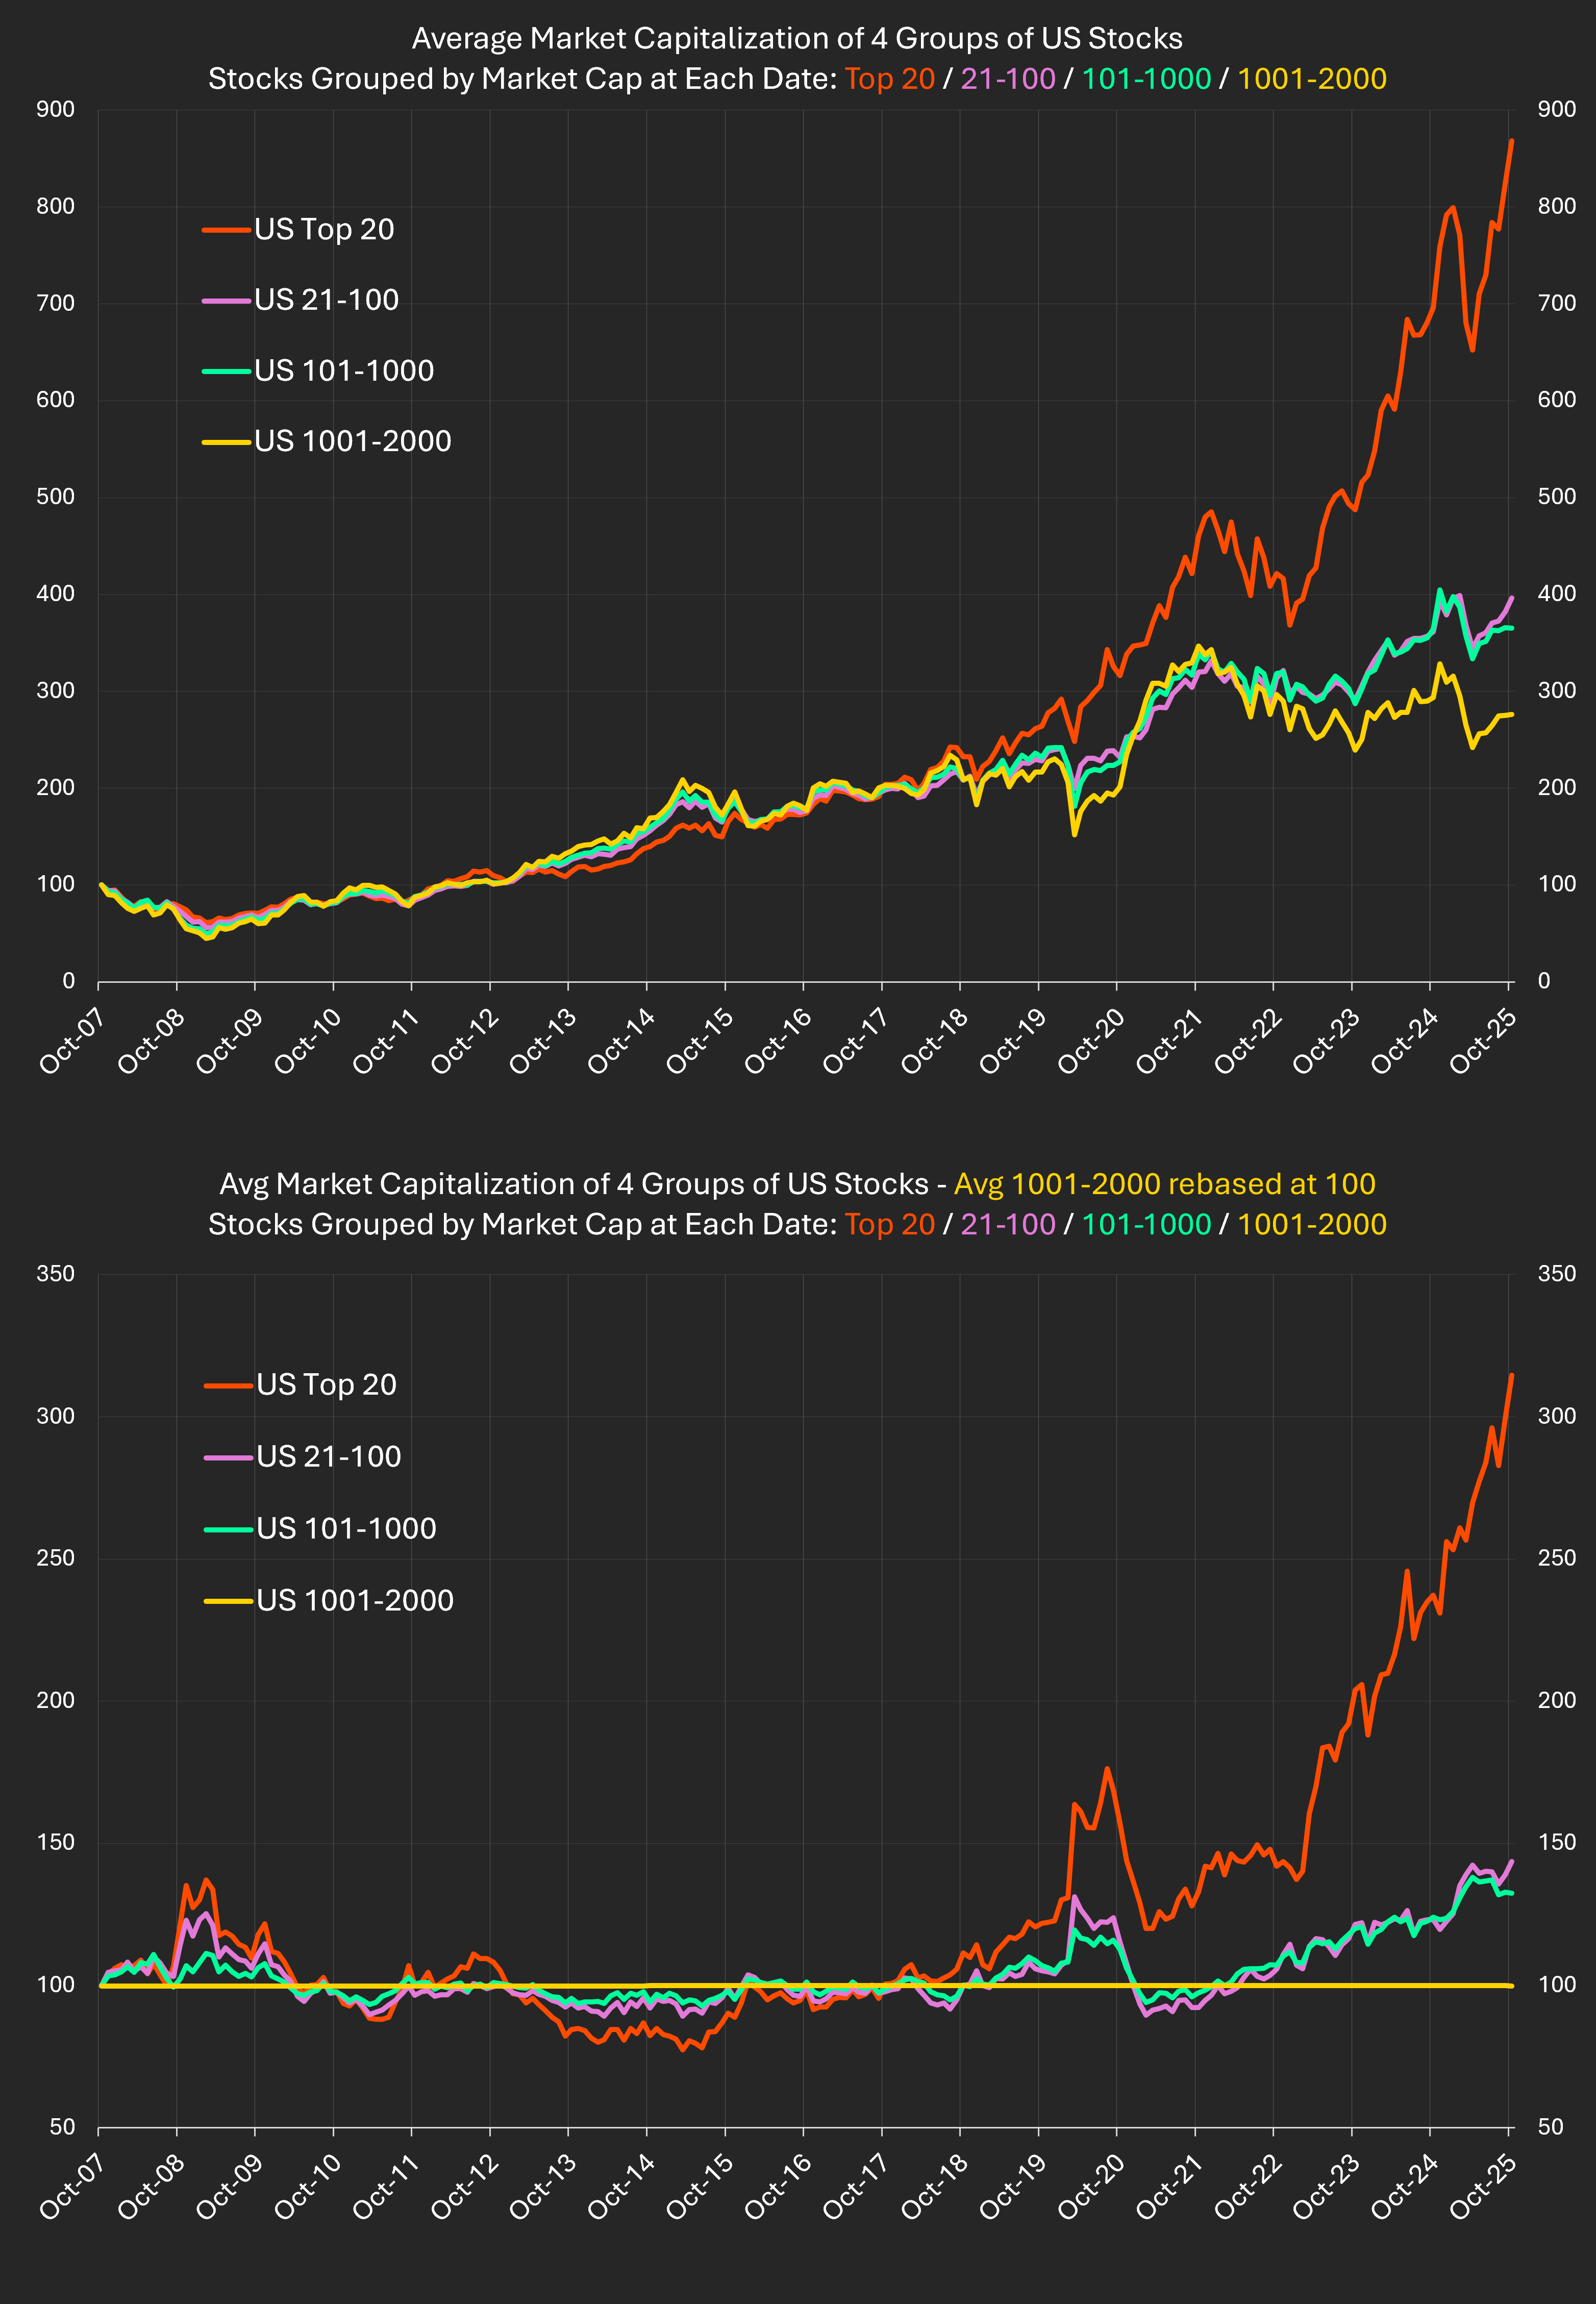
The analysis tracks the evolution of average market capitalization across four dynamic groups of U.S. stocks between October 2007 and October 2025:
(1) ranks 1–20 (2) ranks 21–100 (3) ranks 101–1000 (4) ranks 1001–2000.
Each group is rebalanced monthly by market-cap rank and rebased to 100 in October 2007.
The top chart shows the evolution of each group’s average market capitalization.
The bottom chart shows each group’s “distance” to the 1001–2000 segment – how the gap in average market capitalization has changed relative to October 2007.
For example, today the Top-20 reads 314 in the bottom chart, meaning their average market capitalization has grown 3.14 × faster than that of the 1001–2000 segment since 2007.
The ratio of the average market capitalizations of groups 2 and 3 is almost unchanged from 2007 (+8.5 %), confirming that the concentration story is essentially a Top-20 phenomenon.
The surge in concentration forces a rethink of diversification, valuation, and portfolio risk.
Insights from Goldman Sachs’ Market Concentration: How Big a Worry? (2024) highlight several key points:
U.S. equities have risen sharply overall, but leadership has changed.
The Top-20 have accelerated far beyond the rest, while the broader market has expanded without major reshuffling below that line.
Whether this gap keeps widening or mean-reverts will shape the next decade of active management and redefine diversification itself.
Data: Sismo dynamic universes built on S&P Capital IQ global equity coverage. Analysis as of October 2025.