Trading Activity and Price Moves: 944 Weeks of S&P 500 History Tell a Subtler Story
Last week reminded us how subtle the link between price moves and trading activity can be.
The S&P 500 had a difficult week, especially for tech:
• Semiconductors averaged –3.3 % (Nvidia –7.1 %)
• Software averaged –3.6 % (Synopsys –13.3 %)
Yet the change in trading intensity told a different story.
Average daily shares traded fell 7 % for semiconductors (–10.8 % for Nvidia) but rose 26 % for software.
That contrast led us to revisit the long-term relationship between:
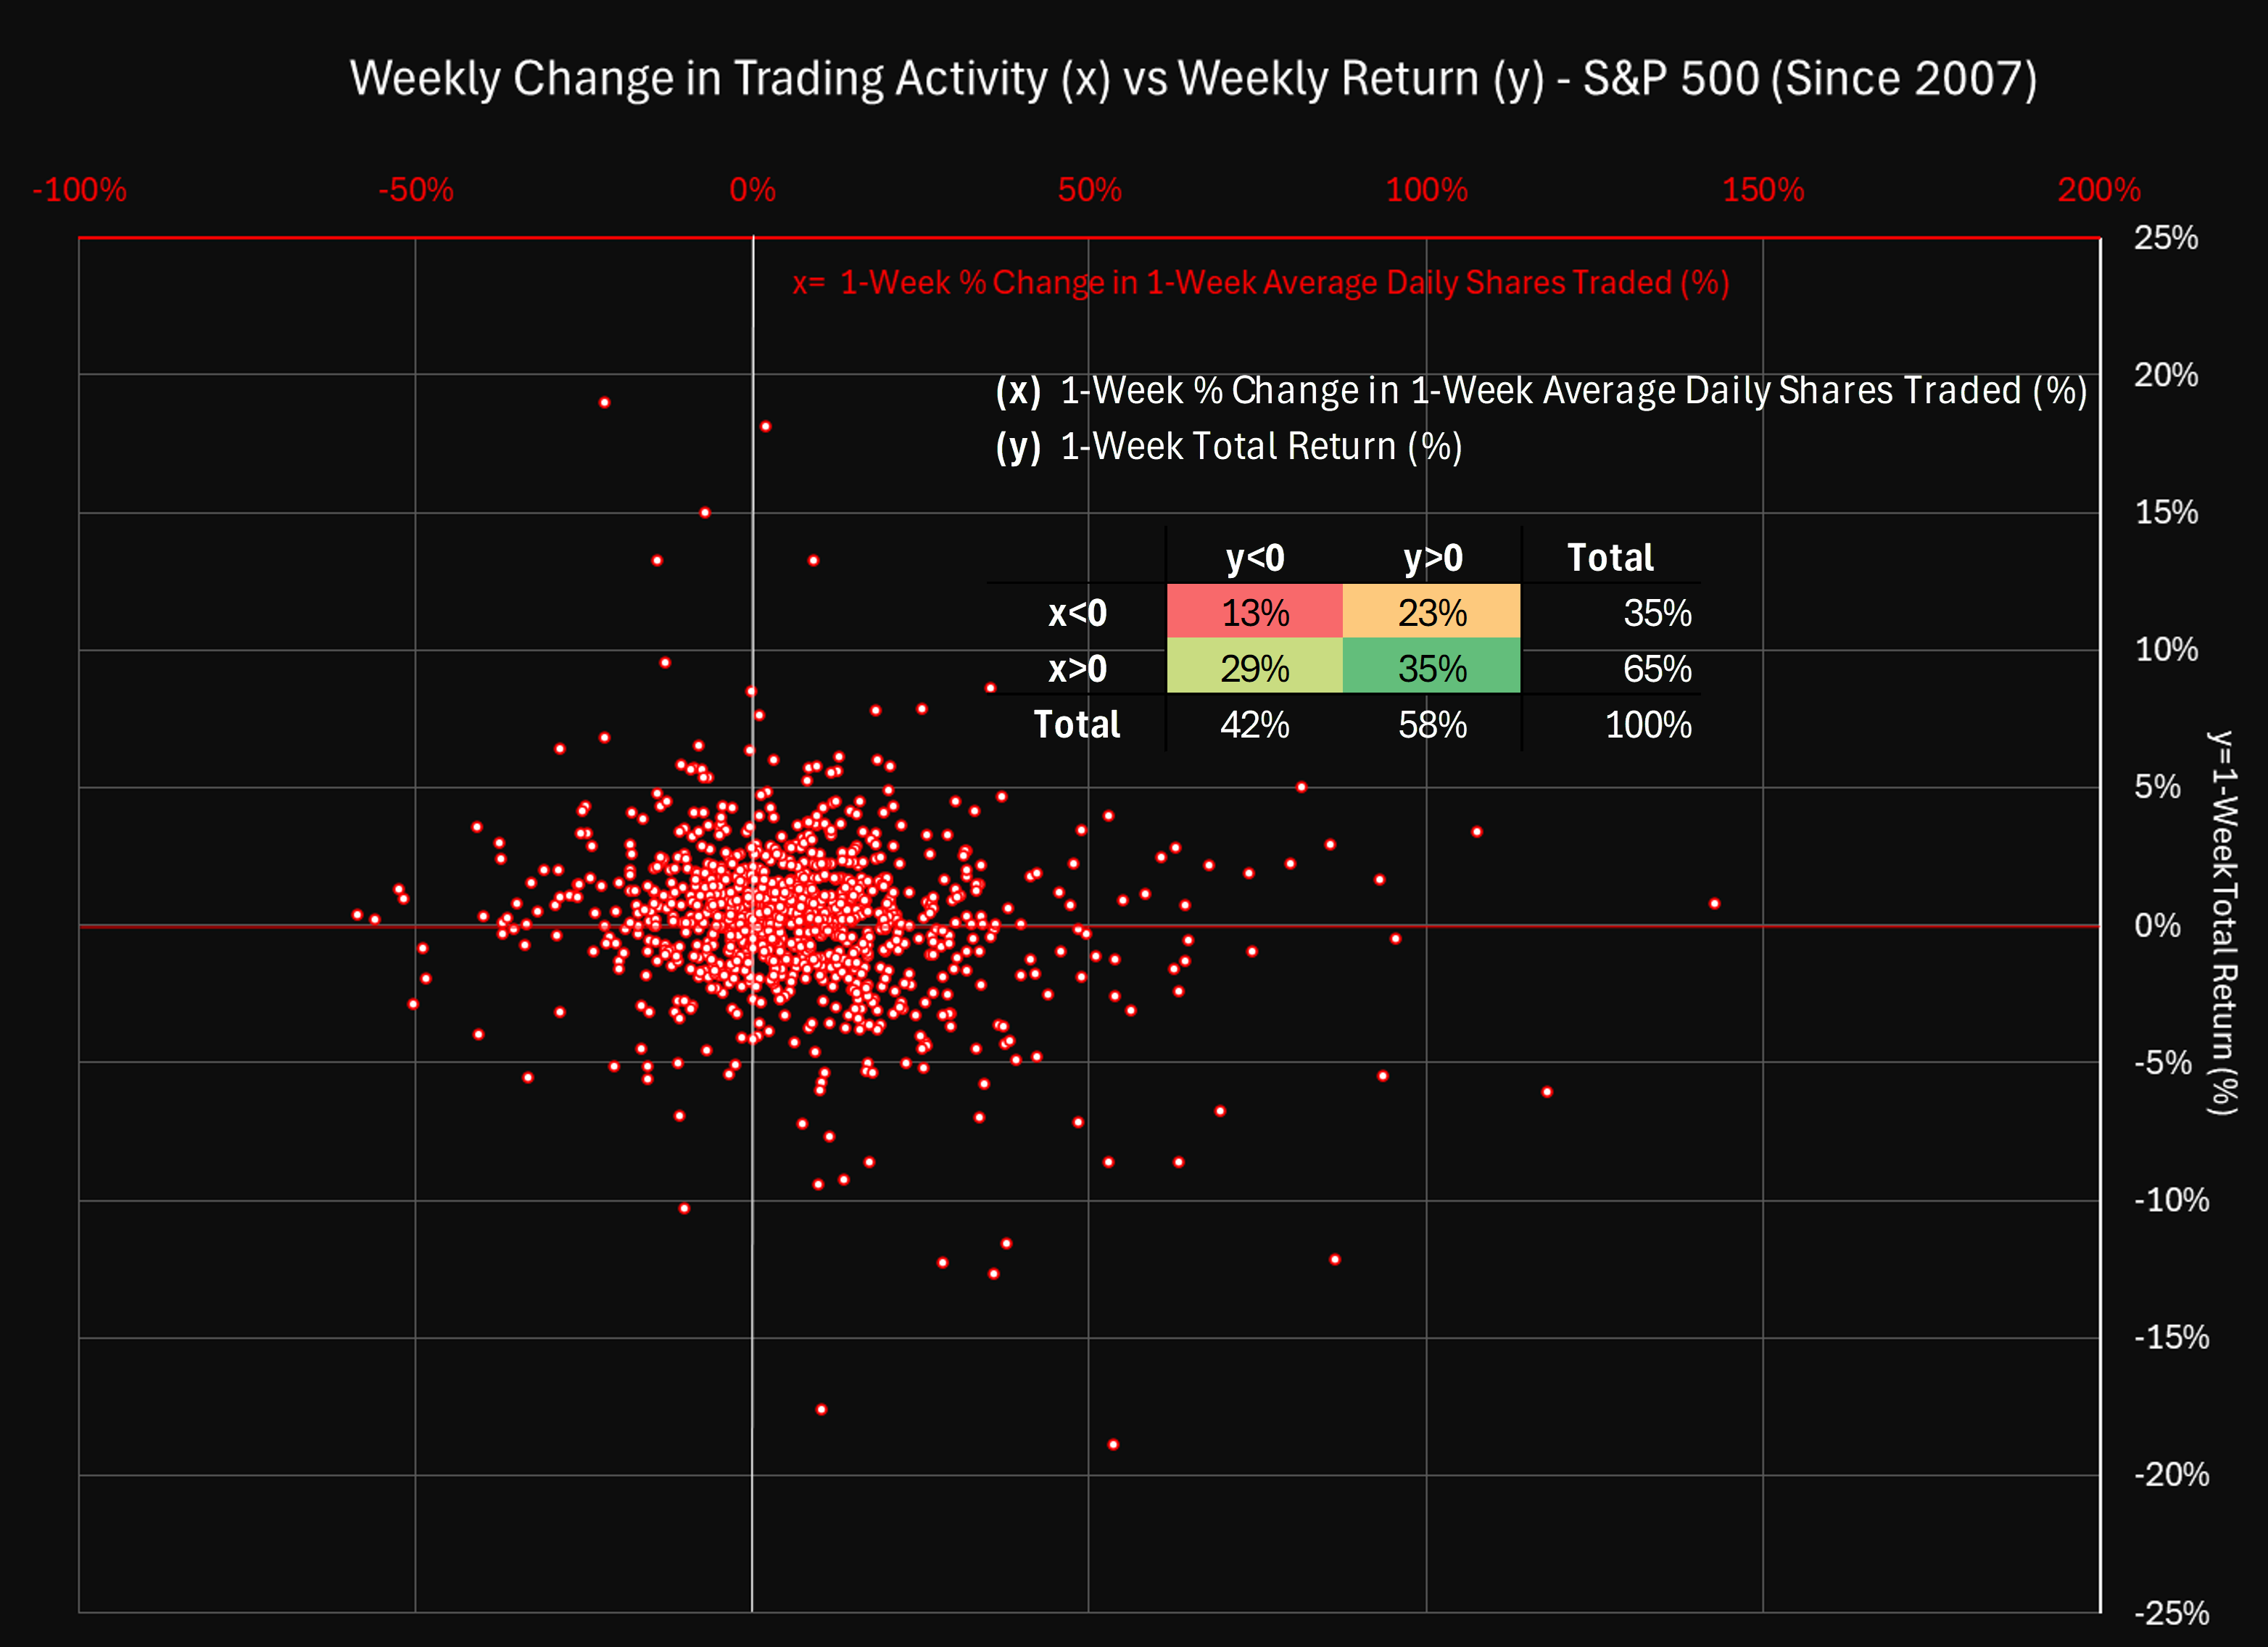
x = 1-week % change in 1-week average daily shares traded
y = 1-week total return
Using 944 weekly observations since October 2007 (S&P 500, equal-weighted cross-sectional averages), we plotted y vs x.
The scatter - with a small table inset - summarizes the entire distribution.
What stands out
• In roughly two-thirds of all weeks, x > 0: trading activity increases compared to the previous week.
Yet average volume over time is flat. The pattern is asymmetric - many small increases, offset by fewer but sharper declines.
• The sign of x doesn’t determine the sign of y.
Markets drift upward more often when activity contracts, while rising activity is associated with both rallies and drawdowns.
• Negative returns often come with rising activity.
A market decline is noticeably more likely to coincide with a rise in trading activity than with a slowdown - roughly two times out of three.
How it fits broader evidence
Academic research (Karpoff 1987; Clark 1973) has long shown that trading volume correlates with volatility, not direction.
This aligns with the “mixture-of-distributions” view: bursts of information drive both price changes and turnover.
Whether the signal is good or bad, investors act more when the market is reassessing risk.
For investors
Changes in trading activity don’t reveal a bullish or bearish bias.
They reflect engagement - moments when the market is reacting, reallocating, or repricing.
Periods of reduced activity often accompany steady gains.
Periods of rising activity mark transition or stress.
For investors, the message is clear: volume change is a context variable, not a signal.
It tells you when the market’s attention has shifted - and that’s when new information matters most.
(Analysis produced with Sismo. The chart shows y plotted against x across 944 weekly observations, with summary frequencies displayed in the inset.)