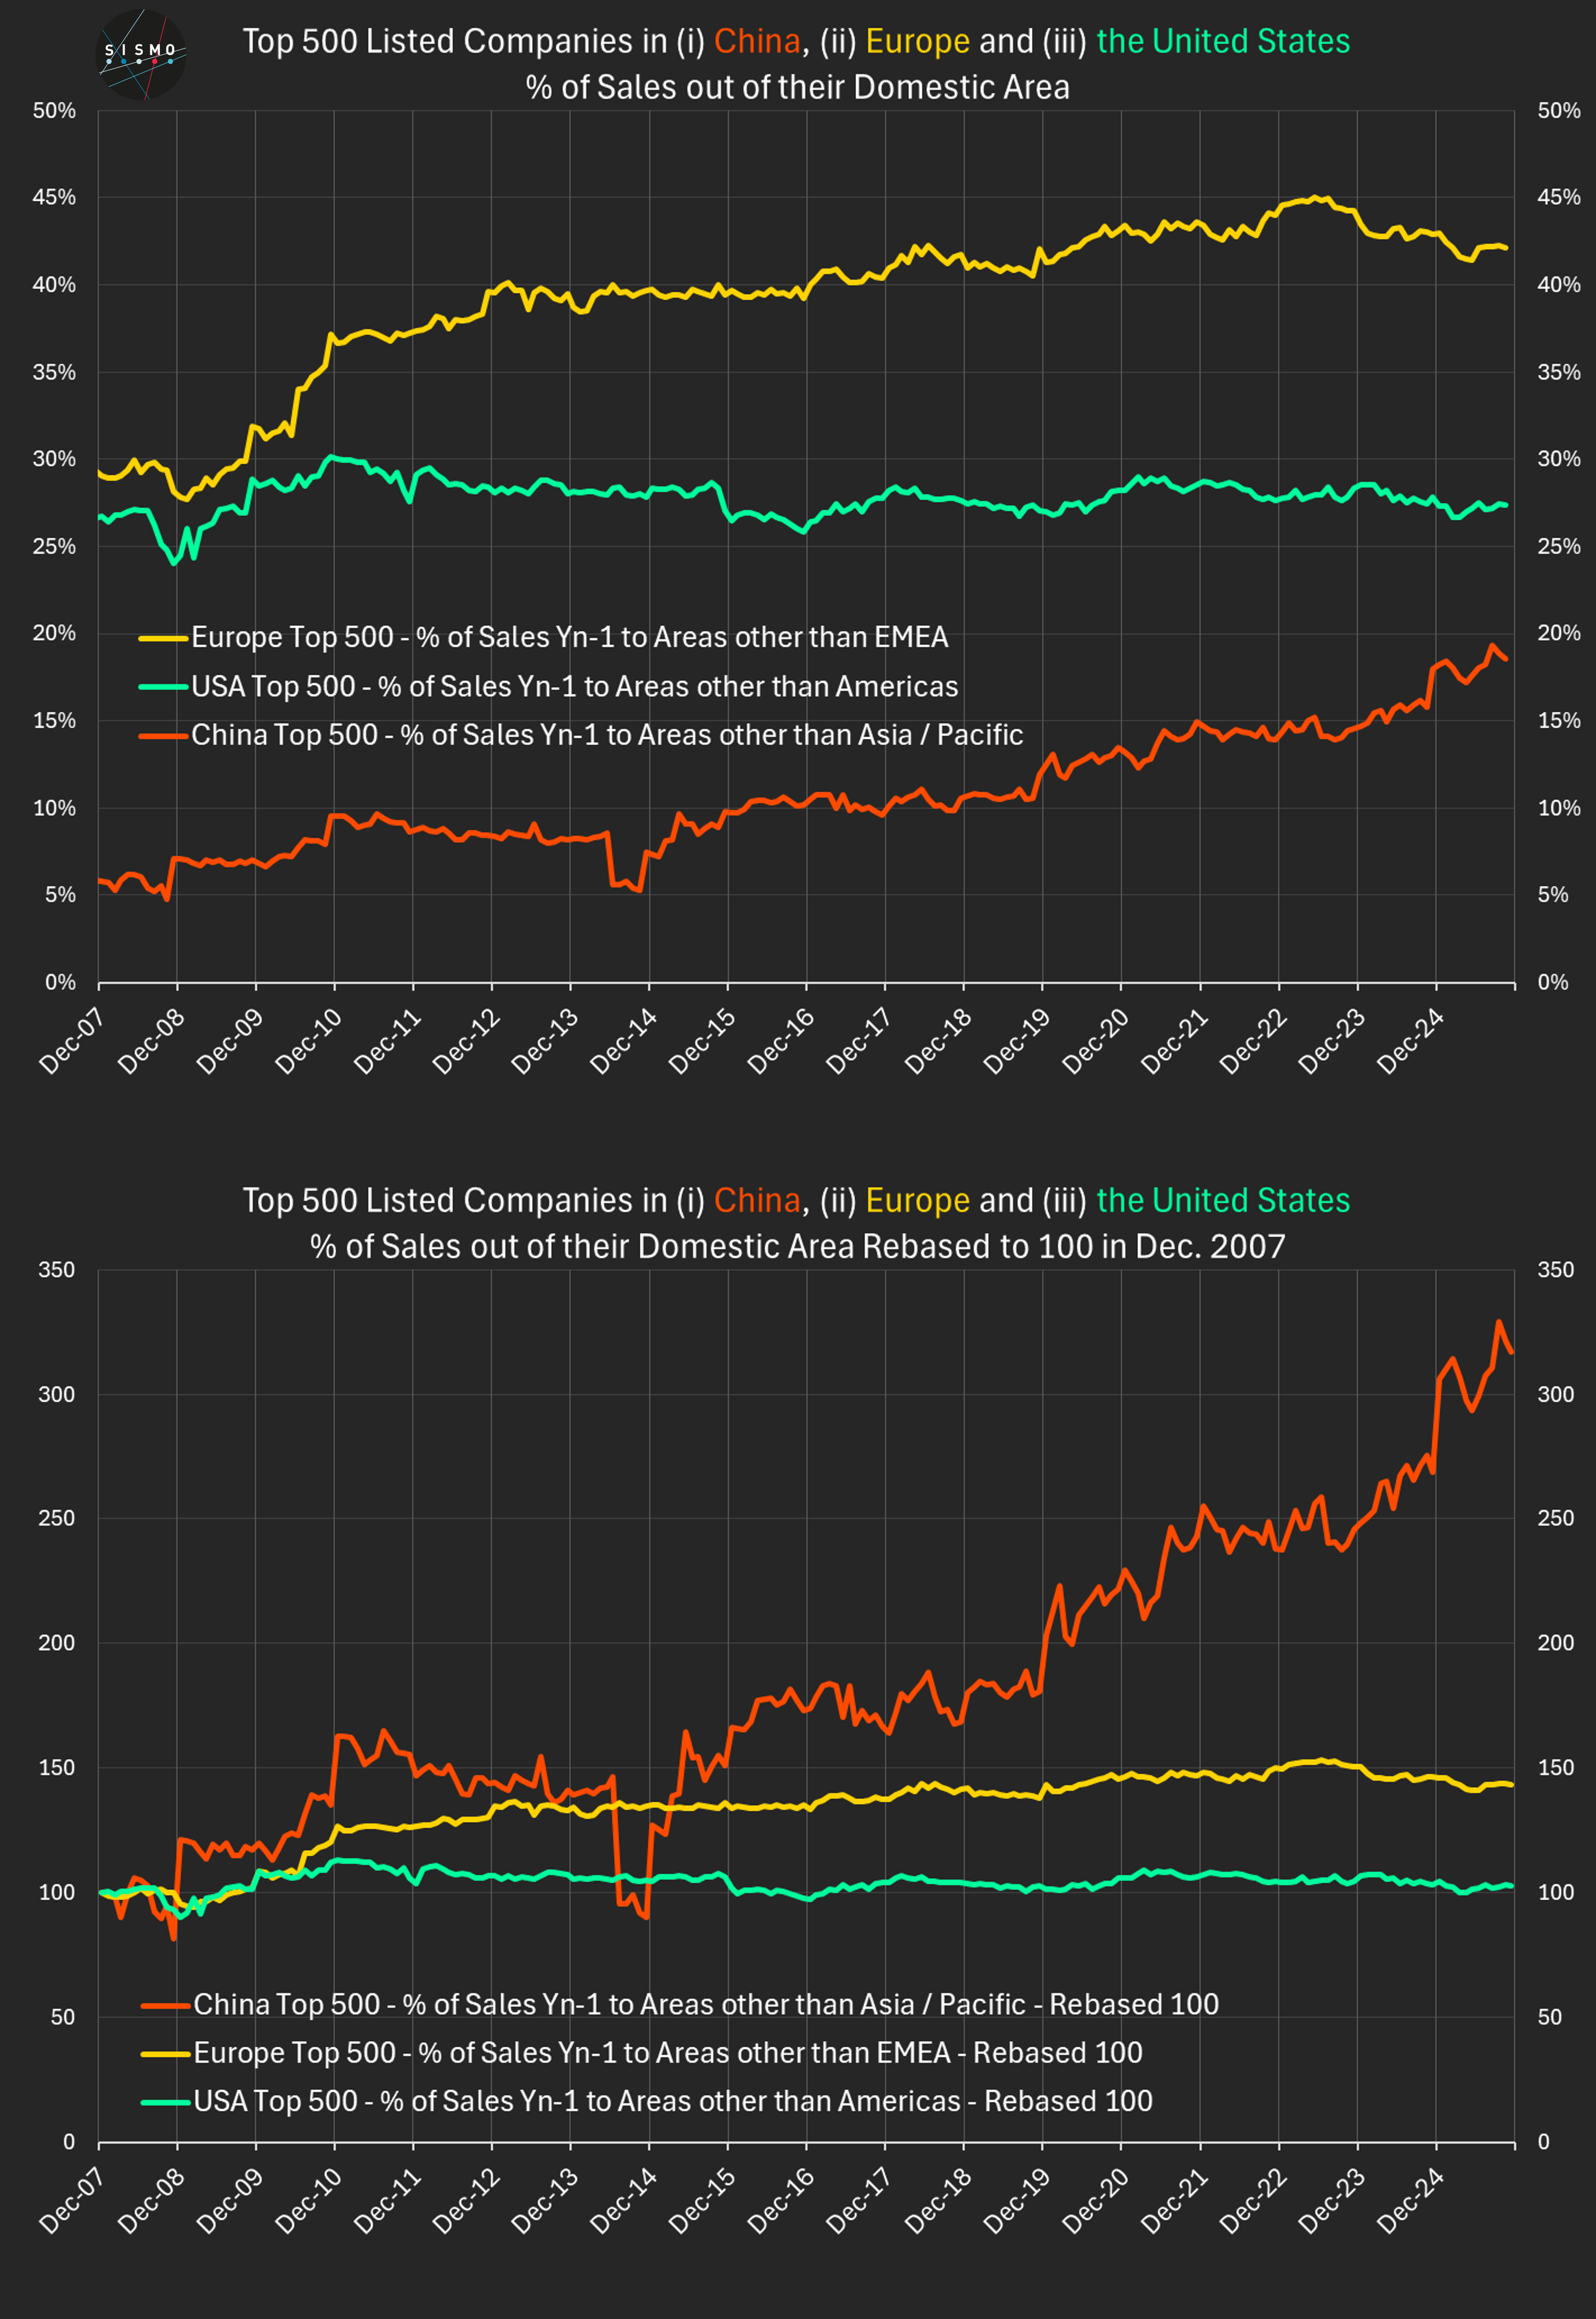
Using Sismo, we analyzed 18 years of geographic revenue data for the top 500 listed companies in China, the U.S. and Europe. Two long-term charts summarize the results:
The findings challenge several widely repeated assumptions.
1. China is not as export-dependent as often claimed
For Chinese large caps, the average share of revenues generated outside Asia/Pacific rose from ~6% to ~18% since 2007 - a three-fold increase.
China’s top companies remain the most regional of the three blocs, but the internationalization trend is clear.
2. U.S. companies are far more domestic than the global narrative suggests
For nearly 20 years, U.S. large caps have generated on average only ~25–30% of revenues outside the Americas. The indexed line is almost flat.
Despite their global visibility, most U.S. champions still earn the bulk of revenues in their home region.
3. Europe is structurally the most international of the three
European large caps generate ~42%of revenues outside EMEA today, up from ~29% in 2007.
They show both the highest international share and the strongest upward trend. This mirrors decades of corporate-strategy research showing that European firms expand abroad to offset structurally slower regional growth.
What this tells us
Across the world’s largest listed companies:
Capital flows may be global, but
➡️ corporate revenues remain overwhelmingly regional.
Methodology
To ensure consistent comparison across regions, “home markets” follow the broad geographic regions most widely used in company reporting (China → Asia/Pacific, U.S. → Americas, Europe →EMEA). The universe is dynamic: each month, we take the top 500 companies by market cap at that date, so the composition naturally evolves with market conditions. Revenues rely on company-reported geographic segmentation; no size weighting is applied.
Sismo makes this type of long-horizon geographic and factor analysis instantaneous across any universe or portfolio.